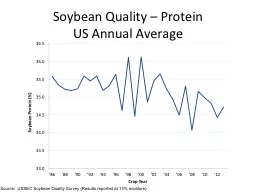
US Annual Average Source USSEC Soybean Quality Survey Results reported at 13 m oisture Soybean Quality Oil US Annual Average Source USSEC Soybean Quality Survey Results reported at 13 ID: 407754
Download Presentation The PPT/PDF document "Soybean Quality – Protein" is the property of its rightful owner. Permission is granted to download and print the materials on this web site for personal, non-commercial use only, and to display it on your personal computer provided you do not modify the materials and that you retain all copyright notices contained in the materials. By downloading content from our website, you accept the terms of this agreement.
Slide1
Soybean Quality – ProteinUS Annual Average
Source: USSEC Soybean Quality
Survey (Results reported at 13%
m
oisture)Slide2
Soybean Quality – OilUS Annual Average
Source: USSEC Soybean Quality
Survey (Results reported at 13%
m
oisture)Slide3
Soybean Protein Regions
LowModerate
HighSlide4
Change in Soybean Production by Protein Region
Source:
USSEC
Soybean Quality
Survey Slide5
Percentage Change in Soybean Production by Protein Region
Source:
USSEC
Soybean Quality
Survey Slide6
Soybean Quality Over Time:
Protein by Region
Source: USSEC Soybean Quality
Survey (Results reported at 13%
m
oisture)Slide7
Soybean Quality Over Time:
Oil by Region
Source: USSEC Soybean Quality
Survey (Results reported at 13%
m
oisture)Slide8
$0.14
$0.16
$0.28
$0.30
$0.19
$0.33
$0.10
$0.33
$0.15
$0.03
$0.09
$0.32
CPD due to Quality
CPD due to Transportation & Other
CPD* Differences for Various Midwestern States versus Illinois
$0.09
$0.05
*Cash Price DifferentialSlide9
Source: USDA-GIPSA
EGIS
MY 2013 includes data through April 17, 2014
U.S. Soybean Export Share by
Region
MY 1996-13 EGIS DataSlide10
U.S. Soybean Export Share by
Region
MY 1996-13 EGIS Data
Source: USDA-GIPSA
EGIS
MY 2013 includes data through April 17, 2014