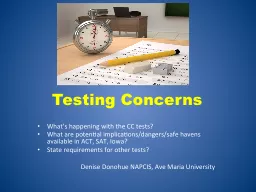
What are potential implicationsdangerssafe havens available in ACT SAT Iowa State requirements for other tests Denise Donohue NAPCIS Ave Maria University Federally funded ID: 657040
Download Presentation The PPT/PDF document "Testing Concerns What’s happening with..." is the property of its rightful owner. Permission is granted to download and print the materials on this web site for personal, non-commercial use only, and to display it on your personal computer provided you do not modify the materials and that you retain all copyright notices contained in the materials. By downloading content from our website, you accept the terms of this agreement.
Slide1
Testing Concerns
What’s happening with the CC tests?What are potential implications/dangers/safe havens available in ACT, SAT, Iowa?State requirements for other tests? Denise Donohue NAPCIS, Ave Maria UniversitySlide2
Federally funded National Assessments
$175 million 4 yr. grant from US DOE to Smarter Balanced Assessment Consortium in 2010.$185 million 4 yr. grant to Partnership for Assessment of Readiness for College and Careers (PARCC).Three additional assessment companies are working on tests for students with severe cognitive disabilities and English language learners per ETS. (Funding not mentioned). * Retrieved from www.smarterbalanced.org/resources-events/faqs and PARCConline.orgSlide3
Testing for grades 3-8, 11 22 States and 19 million students.
Smarter Balanced Assessment ConsortiumWashington State,
Oregon, Idaho,
California, Nevada,
Wyoming, North
Dakota, South Dakota,
Kansas, Iowa, Wisconsi
n
,
West Virginia, North
Carolina, South Carolina,
Delaware, Vermont,
Connecticut, Wisconsin,
New Hampshire, Maine,
Montana.
Michigan is vacillating at
t
his time.
Missouri & Utah withdrew.Slide4
Field testing for Smarter Balanced Assessments are March 18 – June 6, 2014Slide5
Number, type, and length of Tests developed by Smarter Balance
Interim Assessments – administered at locally determined times. “Involve a large teacher role in developing and scoring constructed response items and performance task”. Summative, end-of-year, assessment - within last 12 weeks of school. Computer adaptive and performance based. Allows for a quick turnaround time.Cost between $22.50 - $27.30 per student (including scoring services that state must procure on their own).
Will have tests for ESE and ELLs. Slide6
Number, type, and length of Tests developed by Smarter Balance
Multiple choice, short constructed response, and extended constructed response.Performance tasks allow students to complete an in-depth project that demonstrates analytical skills and real-world problem solving (Smarter balance: Frequently asked questions, p.3). Uses sets of connected, themed questions, scenarios. Will take one to two class periods to complete (not computer adaptive). Designed as untimed tests estimated to take between 7 – 8 ½ hours.Slide7
Assessments are for
grades 3-11 and are estimated by PARCC to include between22-25 million children in these states.
Currently 14 governing States
a
nd the District of Columbia.
Arizona
, Arkansas,
Colorado,
District
of
Columbia,
Illinois
,
Louisiana
, Maryland
, Massachusetts
, Mississippi
, New Jersey, New Mexico, New York, Ohio, Rhode Island, Tennessee. Participating membersKentucky, Florida, Pennsylvania.Indiana, Georgia, Oklahoma, Alabama have withdrawn altogether.
Partnership for Assessment of Readiness for College and CareersSlide8
Field testing for PARCC Assessments are March 24 – April
11, 2014 for Performance Tests and May 5 – June 6, 2014 for End of Year AssessmentsSlide9
Number, type, and length of PARCC Assessments
As many as 7 separate tests throughout the year:Diagnostics in reading, writing, and mathematicsMid year assessments in ELA/literacy and mathematicsPerformance-based in ELA/literacy and mathematicsEnd-of-Year Assessment
in ELA/literacy and mathematics
Speaking and listening component
(1 test) ELA/literacy and mathematics
Performance & EOY assessments in ELA/literacy and math:
8 hours
annually in 3
rd
grade.
Just over
9 hours
for Grades 4-5
A little less than
9 ½ hrs
.
for middle school A little more than 9 ½ hrs. for high schoolSlide10
Use of PARCC for college entranceConsideration of using PARCC End of Year assessment for higher education college acceptance “ultimately rests with the states, colleges and/or universities” (p.5).
“K-12 and higher education leaders in PARCC states are working together to develop the college and career-ready assessments to increase the likelihood higher education institutions will accept a PARCC College and career-ready Determination” (p.5).Slide11
Number of children effected by
CCSS AssessmentsTotal number of school children in the U.S.(nces, 2013) 55 million -Of this number 5.5 million are private school students
(nces,2013)
Total covered by Common Core States
41 million
(As reported by PARCC & Smarter Balanced)
Total number of students
not covered
14 million
(25%)
Note: Catholic schools are not required to use these tests, although they were presented by the Center for Catholic School Effectiveness with source material in a presentation by Michelle
Lia
on April 12, 2012.Slide12
What assessments are available for these children?
Stanford 10 Aspire IowaSlide13
Stanford 10 Achievement TestsDeveloped by Pearson.
Two different tests available: New and ClassicNormed group 2007 for the New Stanford 10 (prior to CCSS implementation).Used for grades K-12.Pricing is $9.28 per consumable, $7.78 for reusable and $2 for answer sheet. Form A & Form D. Form A aligned to CCSS.Designed to be administered during the later part of the school year – Spring.Spring or Fall Norms.Uses Otis-Lennon Ability Tests.Slide14
Stanford 10 Achievement TestsNew
Reading, Language – IRA/NCTE Standards.Mathematics - Uses NCTM Principles and Standards for School.Social Sciences- Geography for Life: National Geography Standards & National Standards for Civic Government & Voluntary National Content Standards in Economics.Science
– “Current science practice & research” “Aligns with state standards
”
http
://www.pearsonassessments.com/haiweb/cultures/en-us/productdetail.htm?pid=
SAT10C
- under Content.
Classic
Reading, Language
–
NAEP
*
Mathematics
– NAEP
Social Sciences
- National Council for the Social Sciences (NCSS) Curriculum Standards for SS, National Content Standards.
Science
– National Research Council, National Science Education Standards & The Benchmarks for Science Literacy (American Association for Advancement of Science).
*
Susan Pimentel, lead writer of CCSS, is the VP of NAEP governing board
www.nagb.org
/who-we-are/members/bios/
b_pimentel.html
Slide15
Aspire
New test in development by ACT.Designed for grades 3-8 and 9/10thAre currently being field tested and will be launched in Spring 2014.Has an accommodation module that supports audio support, sign language, and braille.Spanish assessment for grades 3-6.At this point the turn around time is estimated to be 4-6 weeks for the pencil & paper option. (This option is not mentioned on the website. Info obtained from phone call.) Slide16
Aspire cont’dThe reports will be tied to the ACT 1-36 Career and college readiness scale.
Will have student constructed response items, but not announced who, or how, these will be graded.Fully aligned to Common Core. Cost not determined.Computer based option is workable on current releases or earlier of computer operating systems. Slide17
Iowa Forms E & F
Parallel forms developed by University of Iowa and marketed by Riverside Publishing Co.Normed 2011 (during early release of CCSS) and good for 5-10 years before new norming is performed. (2016)Development of Form E was “informed” by framework copies of CCSS, national standards, and from other multiple associations.Uses multiple measures within each indicator to assess cognition: Essential is recall, Conceptual is two steps (inference), Extended is multiple steps. Slide18
Iowa Form E & F Cont’dDataManager is in-house report generator maintained by in-house
Test Administrator.Can toggle between traditional reports and Common Core reports. Can perform filtered reports by populations.Has beginning and mid-year interim assessments.All data maintained in-house.Can administer with paper and pencil or online.DataManager is purchased with Form E or F only (not previous versions).Uses the Cogat Form 7 for ability.Spring or Fall norms. (Kindergarten is Spring only for Reading).
Cost is $10.08 Grades K-3 and $7.43 Grades 4-12 (need to purchase answer sheet). This includes the DataManager option.
Longest testing time for full battery is
4 hr. 55 min.Slide19
State-developed testsFlorida will test with the FCAT.
2.9 million students.Texas has the STARR test (2012). 3.1 million students (grades 3-8, EOC)Virginia has Standards of Learning (SOL) tests (2012-13) 1.3 million students (grades 3,5,8, and EOC)
Nebraska has
NeSa
tests (2010 – 2012)
(grades 3-8, 11)
332,138 students
Alaska has SBA
(Standards Based Assessment)
(grades 3-10)
132,935 studentsSlide20
What about college entrance exams?Slide21
ACTCCSS adopted ACT’s definition of “ready for college and career”.
CCSS used the ACT longitudinal research identifying required knowledge and skills essential for post-secondary education and workforce training.Slide22
Alignment between ACT and CCSS is significant.ACT “
Pledges” to “work with stakeholders to develop strategies and solutions that maximize the coverage of the Common Core State Standards to meet the future needs of states, districts, schools, and students”(p.2).The ACT Course Standards called QualityCore, are empirically derived course standards developed by ACT for their “high school instructional program” and are 100% aligned to CCSS.Slide23
ACT is predominately aligned already.
ACT, (June 2010). The alignment of common core and ACT’s college and career readiness system. p.5.
ACT test alignment to Common Core State Standards (or CCSS alignment to ACT!)Slide24
CCSS grades 6-8 ACT’s EXPLORE for grades 8 & 9
304 page document with similar comparisonsSlide25
SAT
David Coleman, primary architect for Common Core State Standards, became president of the College Board in October 2012.Announced in Feb. 2013, that SAT will change to align with CCSS.SAT was previously aligned in 2005 to add writing component expending from 1600 to 2400 scoring and additional test time.Concerned that ACT will become the test of choice for students as the number of test-takers taking the ACT surpassed the SAT test-takers in 2011.** Layton, L., & Anderson, N. (2013). College Board to make changes to SAT.Slide26
Front page of SAT website indicates call to action for stagnate 2013 SAT scores –
addressing this need to the K-12 community.New Philanthropic Stewardship Report – collaborations with US Dept. of Ed. & Gates Fd. Slide27
“Over the past year, the College Board’s members have called for a renewed focus on our social
mission by declaring that the students in our programs are within our care. We are workingclosely with our members in the K-12 and higher education communities to fulfill this chargeand break down the barriers that prevent students from realizing opportunities.”Slide28
Only means for college entry?Nearly 850 Colleges and Universities have backed away from using the SAT/ACT as sole criteria for college entrance preferring to deemphasize their use and place a greater emphasis on student’s grades in high school as a more valid indictor of college success.
www.fairtest.orgCromwell, A., McClarty, K., & Larson, S. (2013). College Readiness Indicators. Pearson.Geiser, S., Santelices, M. (2007). Validity of high-school grades in predicting student success beyond the freshman year: High school record vs. standardized tests as indicators of four-year college outcomes.
Research & Occasional Paper Series:CSHE.6.07
Berkeley, CA:
Center for Studies in Higher
E
ducation. Slide29
Can a school use direct instruction or other traditional pedagogy
and use these tests?Iowa Form E – Yes.Stanford 10 (New) – Yes. NCTM, IRA/NCTEThe question revolves around “rigor”.Aspire – Unknown.PARCC – no
Smarter Balance - noSlide30
College Board’s (SAT) 1st annual Philanthropic Stewardship ReportJuly 1, 2011 – June 30, 2012
Report indicated total new funds granted during the year were $13,495,407 of which $10,454,125 (77%) were from the US Dept. of Education. Total amount reported from all funds were $51,886,272 of which $14,056,150 are from the Bill & Melinda Gate Foundation (27%) and $10,454,125 (20%) were from US. Dept. of Ed.