PDF-Leveraged & Inverse ETFs
LABU LABD
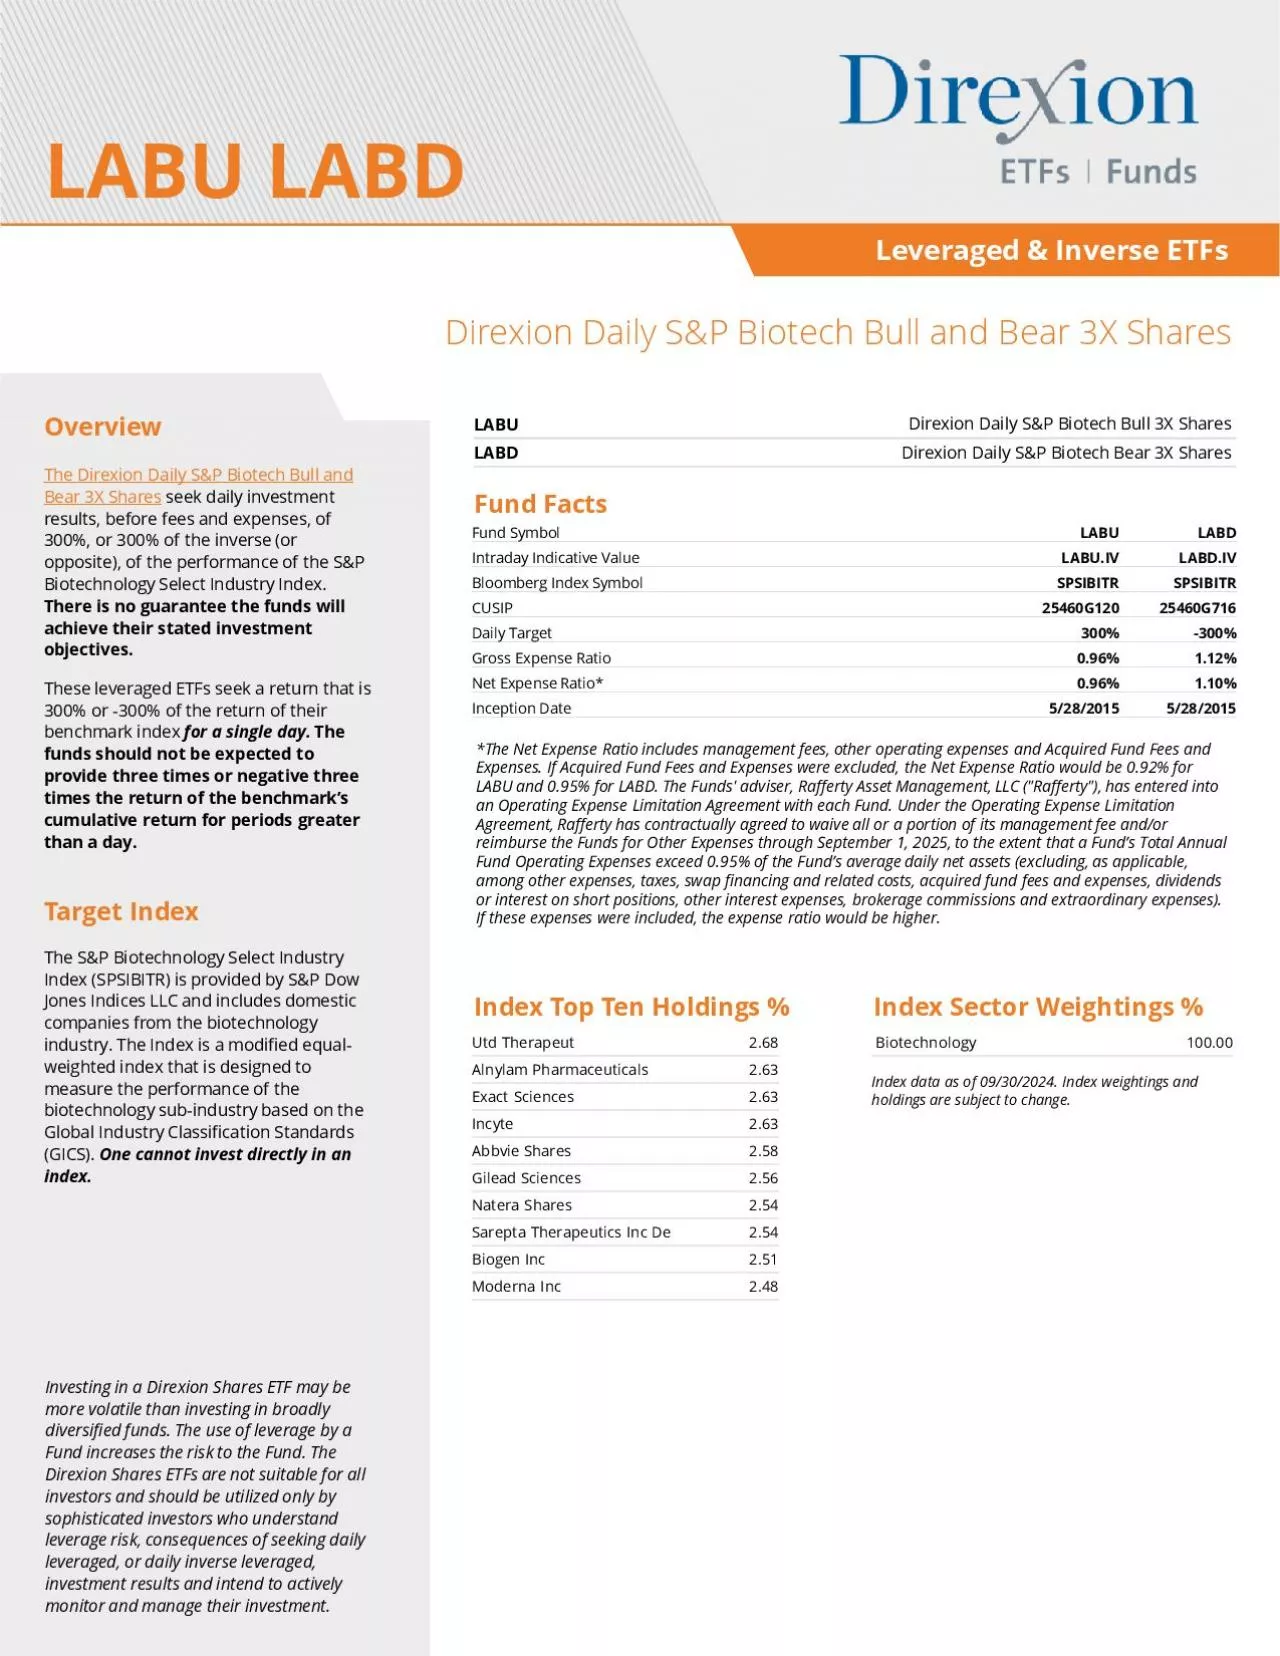
Daily SP Biotech Bull and Bear 3X Shares
Overview
The Direxion Daily SP Biotech Bull and
Bear 3X Shares seek daily investment
results before fees and expenses
Download Presentation
"Leveraged & Inverse ETFs" is the property of its rightful owner. Permission is granted to download and print materials on this website for personal, non-commercial use only, provided you retain all copyright notices. By downloading content from our website, you accept the terms of this agreement. Download
Presentation Transcript
Transcript not available.