/
Bureau of Justice Statistics Special Report August  NCJ  U Bureau of Justice Statistics Special Report August  NCJ  U

Bureau of Justice Statistics Special Report August NCJ U - PDF document

lois-ondreau
lois-ondreau . @lois-ondreau
Follow
596 views
Uploaded On 2014-12-05

Bureau of Justice Statistics Special Report August NCJ U - PPT Presentation

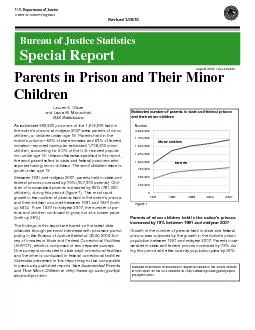
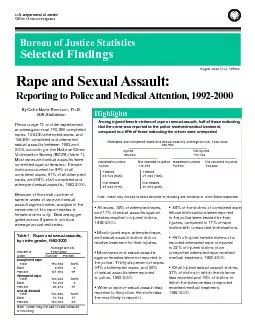
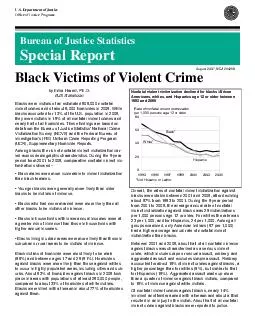
S Department of Justice Office of Justice Programs Black Victims of Violent Crime by Erika Harrell PhD BJS Statistician Blacks were victims of an estimated 805000 nonfatal violent crimes and of about 8000 homicides in 2005 While blacks accounted for ID: 21086

Department Justice Office

Share:

Link:

Embed:

Download Presentation from below link

Download Pdf The PPT/PDF document "Bureau of Justice Statistics Special Rep..." is the property of its rightful owner. Permission is granted to download and print the materials on this web site for personal, non-commercial use only, and to display it on your personal computer provided you do not modify the materials and that you retain all copyright notices contained in the materials. By downloading content from our website, you accept the terms of this agreement.


Presentation Transcript

Bureau of Justice StatisticsAugust 2007, NCJ 214258U.S. Department of JusticeOffice of Justice Programs Black Victims of Violent Crime BJS StatisticianBlacks were victims of an estimated 805,000 nonfatal violent crimes and of about 8,000 homicides in 2005. While blacks accounted for 13% of the U.S. population in 2005, they were victims in 15% of all nonfatal violent crimes and nearly half of all homicides. These findings are based on data from the Bureau of Justice Statistics’ National Crime Victimization Survey (NCVS) and the Federal Bureau of Investigation’s (FBI) Uniform Crime Reporting Program (UCR), Supplementary Homicide Reports. Among blacks the risk of nonfatal violent victimization var-ied across demographic characteristics. During the 5-year period from 2001 to 2005, comparative nonfatal violent vic-timizations showed – • Black males were more vulnerable to violent victimization than black females. • Younger blacks were generally more likely than older blacks to be victims of violence. • Blacks who had never married were more likely than all other blacks to be victims of violence. • Blacks in households with lower annual incomes were at a greater risk of violence than those in households with higher annual incomes. • Blacks living in urban areas were more likely than those in suburban or rural areas to be victims of violence. Black victims of homicide were most likely to be male (85%) and between ages 17 and 29 (51%). Homicides against blacks were more likely than those against whites to occur in highly populated areas, including cities and sub-urbs. About 53% of homicides against blacks in 2005 took place in areas with populations of at least 250,000 people, compared to about 33% of homicides of white victims. Blacks were killed with a firearm in about 77% of homicides against them.Overall, the rates of nonfatal violent victimization against blacks were stable between 2001 and 2005, after declining about 57% from 1993 to 2001. During the 5-year period from 2001 to 2005, the average annual rate of nonfatal violent victimization against blacks was 29 victimizations per 1,000 persons age 12 or older. For whites the rate was 23 per 1,000, and for Hispanics, 24 per 1,000. Among all groups examined, only American Indians (57 per 1,000) had a higher average annual rate of nonfatal violent victimization than blacks.Between 2001 and 2005, about half of all nonfatal violence against blacks was characterized as a serious violent crime, which includes rape or sexual assault, robbery, and aggravated assault and excludes simple assault. Robbery accounted for about 15% of violent crimes against blacks, a higher percentage than for whites (9%), but similar to that for Hispanics (15%). Aggravated assault made up more than a quarter of violence against black victims, compared to 18% of violence against white victims.Of nonfatal violent crimes against blacks, nearly 14% involved an offender armed with a firearm and about a third resulted in an injury to the victim. About half of all nonfatal violent crimes against blacks were reported to police.Nonfatal violent victimization declined for blacks/African Americans, whites, and Hispanics age 12 or older between 1993 and 2005 1993199519971999200120032005Rate of nonfatal violent victimizationBlack*White*Hispanicper 1,000 persons age 12 or older*Not Hispanic or Latino. Black Victims of Violent Crime Violent victimization rates for blacks declined from 1993 to 2001 but were stable from 2001 to 2005The overall rate of nonfatal violent victimization against blacks declined by nearly 57% between 1993 and 2001 (table 1). The rate for the overall population declined 54% during the period (not shown in table). Except for persons age 50 or older, the violent victimization rates declined for all subgroups of the black population that were examined. The decline for black males (61%) was somewhat greater than for black females (53%) (figure 1). By location of residence, from 1993 to 2001 the decline in the rates of violent victimization for blacks in urban areas was smaller than for blacks in rural areas and slightly larger than for those in suburban areas (figure 2). Between 2001 and 2005, the rate of nonfatal violent crimes against blacks did not change significantly despite apparent fluctuations for some subgroups. For the overall population the rate was stable. During this period, there were no significant changes in the rates of violent victimization by gender, age, or location of residence. In 2005 black males were somewhat more vulnerable to violent crimes than black females. Blacks age 24 and under had higher rates of violent victimization than blacks age 25 or older. Blacks living in urban areas had the highest rates of violent victimization in 2005, and those in rural areas had the lowest rates. Table 1. Violent victimization rates of blacks/African Americans by gender, age, and location of residence, 1993, 2001, and 2005Characteristic Violent victimization rate Percent change1993200120051993-2001 2001-2005 Total69.329.728.6-57.1%-3.7%GenderMale79.731.433.0-60.7%Female60.628.425.0-53.2-11.912-15133.051.346.5-61.4%-9.4%16-19124.969.571.9-44.420-24119.638.351.4-68.025-3461.529.529.5-52.035-4962.622.620.1-64.0-11.050-6418.418.816.12.3-14.765 or older11.04.71.1-57.1-77.8Location of residenceUrban86.738.237.3-56.0%-2.2%Suburban54.324.920.2-54.2-18.9Rural37.29.318.2-74.9Not statistically significant.Based on 10 or fewer sample cases. The National Crime Victimization SurveyThe NCVS is the Nation’s primary source of information on the frequency, characteristics, and consequences of criminal victimization. One of the largest continuous household surveys conducted by the Federal Government, the NCVS collects information about crimes both reported and not reported to police.The survey provides the largest national forum for victims to describe their experiences of victimization, the impact of crime, and the characteristics of violent offenders.For current overall estimates of criminal victimization in the United States, see Criminal Victimization, 2005, at ww.ojp.usdoj.gov/bjs/abstract/c&#xw-60;v05.htm. Other findings from the NCVS are also on the BJS website. Violent victimization of blacks/African Americans by location of residence, 1993-2005 1993199519971999200120032005UrbanSuburbanRuralRate of violent victimization per 1,000 black persons age 12 or older Violent victimization of blacks/African Americans, by gender, 1993-2005Figure 1 1993199519971999200120032005100MaleFemaleRate of violent victimization per 1,000 blackpersons age 12 or older Black Victims of Violent Crime Violence against blacks that was reported to police varied by victim’s gender and age (table 10). Violence against black females was more likely than violence against black males (63% compared to 47%) to be reported to police. Violent crime against the oldest blacks was more likely to be reported than violent crime against the youngest. About 73% of violence against blacks age 65 or older were reported to police, compared to about a third of violent crime against black victims ages 12 to 15.Police responded quickly to the majority of reported nonfatal violence against blacksAccording to black victims, police responded within an hour in about 91% of reported violent victimizations. Police response to nonfatal violence against blacks was similar to that for whites and Hispanics.Black victims of violence were slightly more likely than Hispanics to use services of nonpolice victim agenciesIn about 9% of violent crimes against blacks, the victim sought help from nonpolice agencies that provided services to victims of crime. Black victims of rape or sexual assault were as likely as victims of other types of violent crime to seek assistance from such agencies (table 11). Overall, blacks were as likely as whites, but slightly more likely than Hispanics to seek help from nonpolice victim agencies.The percentage of black victims of nonfatal violent crime who contacted a nonpolice agency for help fluctuated between 1993 and 2005. It reached 11% in 2005 which was similar to the percentage in 1998 and 2003 (figure 7).Race/Hispanic origin of victim who reported violent crime to Percent of violent crime in which police responded within an hour, 2001-2005Black/African American*90.7%White*88.7Hispanic/Latino90.9*Not Hispanic or Latino. Race/Hispanic originPercent of violent crime in which victims received help from nonpolice victim agencies, 2001-2005Black/African American*9.1%White*8.5Hispanic/Latino6.5*Not Hispanic or Latino. Percent of violent crime against blacks/African Americans in which victim received services from nonpolice victim agencies, 1993-2005 199319951997199920012003200510%15%20%Percent of violent crime Table 10. Violent crime against blacks/African Americans reported to police, by victim gender and age, 2001-2005Percent of violent victimizationVictim characteristicsTotalReported to Not reported to GenderMale100%46.853.2Female100%63.236.812-15100%33.366.716-19100%56.343.720-24100%52.747.325-34100%63.736.335-49100%64.635.450-64100%56.343.765 or older100%72.527.5*Note: Excludes cases for which police reporting was unknown.*Based on 10 or fewer sample cases. Table 11. Services received by black/African American victims of violent crime from nonpolice victim agencies, by type of crime, 2001-2005Percent of violent victimizationRape/sexual assaultAssaultAssistance receivedRobberyAggravatedSimple Total100%100%100%100%Received help14.5*9.213.66.0Did not receive help85.590.886.494.0Note: Excludes data for which contact with nonpolice victim-assistance agencies was unknown.*Based on 10 or fewer sample cases. Black Victims of Violent Crime Appendix table 1. Violent victimization rate per 1,000 persons, by gender, age, and marital status, by race/Hispanic origin of victims, 2001-2005Characteristic of victimBlack/African WhiteAlaska NativeAsian/Pacific Hispanic/Total28.722.856.810.624.3GenderMale32.926.058.813.328.0Female25.219.855.28.120.5Age 12-1554.152.764.315.341.016-1965.455.699.026.139.720-2448.551.1122.319.535.825-3429.428.144.412.924.535-4919.520.457.37.017.050-6414.811.031.85.611.065 or older4.02.5--Marital statusNever married42.944.784.717.836.4Married12.510.838.16.212.0Widowed6.55.349.2Divorced or separated28.137.637.719.737.8--Less than 0.05.Not Hispanic or Latino.Based on 10 or fewer sample cases. Appendix table 2. Violent victimization rate per 1,000 persons, by annual household income, location of residence, and region, by race/Hispanic origin of victims, 2001-2005Characteristic Black/African Alaska NativeAsian/Pacific IslanderHispanic/Total28.722.856.810.624.3Annual household incomeLess than $7,50045.150.277.317.033.0$7,500 to $14,99939.237.046.613.6$15,000 to $24,999 43.327.854.611.425.6$25,000 to $34,99929.126.065.717.227.0$35,000 to $49,99925.625.144.710.122.4$50,000 to $74,99921.922.765.711.123.8$75,000 or more22.717.951.98.424.0Location of residenceUrban36.331.782.210.929.7Suburban23.620.562.610.419.5Rural13.220.137.011.3RegionNortheast30.318.076.48.526.0Midwest42.623.634.910.625.4South22.020.667.813.123.1West37.030.765.910.624.6Not Hispanic or Latino.Based on 10 or fewer sample cases. U.S. Department of JusticeOffice of Justice ProgramsBureau of Justice StatisticsWashington, DC 20531Official BusinessPenalty for Private Use $300PRESORTED STANDARDPOSTAGE & FEES PAIDDOJ/BJSPermit No. G-91 Black Victims of Violent CrimeThis report in portable document format and in ASCII and its related statistical data and tables are available at the BJS World Wide Web Internet site: /www.ojp.usdoj.gov/bjs/abstract/bvv&#xhttp;&#x:/-5;c.htm.The Bureau of Justice Statistics is the statistical agency of the U.S. Department of Justice. Jeffrey L. Sedgwick is director.Erika Harrell, Ph.D., wrote this report, under the supervision of Michael R. Rand. Wendy Lin-Kelly, Cathy Maston and Patsy Klaus verified the report. Tina Dorsey and Carolyn C. Williams produced and edited the report, and Jayne Robinson prepared the report for final printing, under the supervision of Doris J. James.August 2007, NCJ 214258 Office of Justice ProgramsInnovation • Partnerships • Safer Neighborhoodshttp://www.ojp.usdoj.gov