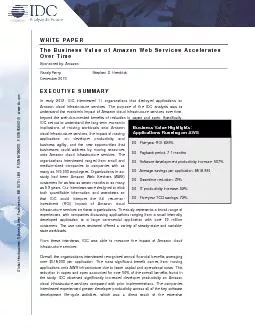
/
Payback period: 7.1 months Payback period: 7.1 months

Payback period: 7.1 months - PDF document

lois-ondreau
lois-ondreau . @lois-ondreau
Follow
397 views
Uploaded On 2016-02-27

Payback period: 7.1 months - PPT Presentation

xF079 Five year ROI 626 xF079 xF079 Software development productivity increase 507 xF079 Average s avings per application 9 90 xF079 Downtime reduction 72 xF079 IT p ID: 234097

 Five - year ROI: 626%   Software development productivity

Share:

Link:

Embed:

Download Presentation from below link

Download Pdf The PPT/PDF document "Payback period: 7.1 months" is the property of its rightful owner. Permission is granted to download and print the materials on this web site for personal, non-commercial use only, and to display it on your personal computer provided you do not modify the materials and that you retain all copyright notices contained in the materials. By downloading content from our website, you accept the terms of this agreement.


Presentation Transcript

 Five - year ROI: 626%  Payback period: 7.1 months  Software development productivity increase: 507%  Average s avings per application : $ , 9 90  Downtime reduction : 72%  IT productivity increase : 52%  Five - year TCO savings: 7 2 % Business Value Highlights : WHITE PAPER The Business Value of Amazon Web Services Accelerates Over Time Sponsored by: Amazon Randy Perry Stephen D. Hendrick December 2013 EXECUTIVE SUMMARY In early 2012, IDC interviewed 1 1 organizations that deployed applications on Amazon cloud infrastructure services . understand the economic impac t of Amazon cloud infrastructure services over time, beyond the well - documented benefits of reduction in capex and opex . Specifically , IDC set out to understand the long - term economic implications of moving workload s onto Amazon cloud infrastructure services , the impact of moving applications on developer productivity and business agility, and the new opportunities that onto Amazon cloud infrastructure services . The organizations interviewed ranged from sma ll and medium - sized companies to companies with as many as 1 6 0,000 employees . Organizations in our study had been Amazon Web Services ( AWS ) customers for as few as seven months to as many as 5.3 years. Our interviews were designed to elicit both quantifiab le information and anecdotes so return - on - investment ( ROI ) impact of Amazon cloud infrastructure services on these organizations . The study represents a broad range of experiences , with companies discussing applications ranging from a small internally developed application to a large commercial application with over 20 million customers . The use cases reviewed offered a variety of steady - state and variable - state workloads. From the s interviews , IDC was able to measure the impact of Amazon cloud infrastructure services . Overall, the organizations interviewed recognized annual financial benefits averaging over $5 1 8,000 per application . The most significant benefit comes from moving ap plications on to AWS infrastructure due to lower capital and operational costs . This reduction in capex and opex accounted for over 50% of the overall benefits found in the study . IDC observed significantly increased developer productivity on Amazon cloud infrastructure services compared with prior implementations . The companies interviewed experienced greater developer productivity across all of the key software development life - cycle activities , which was a direct result of the extensive Global Headquarters: 5 Speen Street Framingham, MA 01701 USA P.508.872.8200 F.508.935.4015 www.idc.com 2 # 236029 ©2013 IDC development and r untime services that are provided by Amazon cloud infrastructure services . Developer and IT staff productivity accounted for nearly 30% of overall financial benefits. The remaining benefits were driven by the flexibility and agility of Amazon cloud infrast ructure services , which make it easier to trial new business models, support revenue - generating applications, and provide more reliable services to end users. These other b enefits included:  Benefits increase over time. There is a definite correlation betwe en the length of time customer s have been using Amazon cloud services infrastructure and their returns . At 36 months , the organizations are realizing $3.50 in benefits for every $1 .00 invested in AWS; at 60 months , they are realizing $8.40 for every $1 .00 invested. This relationship between length of time using Amazon cloud infrastructure services and the customers ' accelerating returns is due to customers leveraging the more optimized environment to generate more applications along a learning curve .  The five - year total cost of ownership ( TCO ) of developing, deploying , and managing critical applications in Amazon cloud infrastructure represents a 7 2 % savings compared with deploying the same resources on - premises or in hosted environments . The findings showed a 626% ROI over five years.  End users benefit ed from fewer service disruptions and quicker recovery on Amazon cloud infrastructure services, re ducing downtime by 72% and improving application availability by an average of 3.9 hours per user per year .  IT staff productivity increased by 52% . IT staff are thus able to improve support of mission - critical operations . Amazon cloud infrastructure services had significant impact on application development and deployment, reducing overall developer hours by 8 0%. The five - year ROI analysis shows that on average , t he companies saw a payback period of seven months and realized a five - year ROI of 626% . 2014 UPDATE Since this study was conducted in early 2012, AWS ha s introduced price reductions nearly 20 times across Amazon EC2 and Amazon S 3 . IDC estimated what the impact of A WS 's fee restructuring would be on the organizations that participated in the 2012 study and determined that the overall fees would drop by 21% lowering the five year TCO from $909,000 to $846,000. SITUATION OVERVIEW Introduction For a company that was founded in 1994 and began delivering cloud computing in 2006 , Amazon is a relative n ewcomer as a Fortune 100 company ( Amazon.com first appeared in the Fortune 100 in 2010 ) , and AWS is one of the oldest cloud computing providers in the industry (AWS started offering services in March 2006) . Although entry into cloud computing was not an in itial design point for Amazon, the demands of ©2013 IDC # 236029 3 creating a reliable, secure, and scalable ecommerce presence , along with the desire to lower prices for its retail customers , led Amazon to focus on driving costs out of its IT infrastructure . Amazon ' s focus on creating a service - oriented architecture put the company o n the as - a - service fast track. Amazon ' s current services in support of application hosting, application management, security, data management, relational databases, nonrelational databases, payments, billing, storage, networking, content delivery, development, deployment, and workflow all come under the heading of AWS . This breadth and depth of AWS has enabled AWS to become the leader in cloud computing . While many enterprises initially thoug ht of AWS as an infrastructure services provider, this percept ion has expanded in recent years in light of the array of runtime services that AWS provides as a platform for application deployment. IT Challenges Today The challenges and opportunities facin g CIOs today have never been greater . As enterprises become more reliant on IT to improve efficiency while simultaneously differentiating services , IT has become a strategic asset in support of business , marketing, product development, and operations . This section identifies a number of the most pressing concerns that IT is tasked with addressing today . Confirmation of these challenges is readily available across the industry , and the issues have been widely reported on by IDC and many of the leading ISVs.  Better alignment of IT with the needs of the business . IT has never been better positioned to address process automation and process improvement needs . Modern IT tools, techniques, and infrastructure are more effective than ever at supporting the needs of the business.  Focus on core business processes . The opportunities for outsourcing, offshoring, and application hosting now provide enterprises with many op tions that allow them to concentrate on improv ing support of mission - critical operations . With mainte nance of existing applications accounting for approximately 50% of IT resources, businesses must make hard decisions regarding where to spend their time.  Simplify, integrate, and automate . Both IT demands and complexity are mushrooming . Enterprises must co nstantly look for ways to simplify and rationalize their approach to IT through the use of more highly abstracted development and deployment tools and policy - and configuration - based services.  Grow organizational profitability . Although IT is not normally considered a profit center, it can contribute to profitability by enabling new business models and finding better ways to manage expenses.  Standardize and consolidate IT assets . Consolidation has been on the IT agenda for years , and virtualization has helped decrease server sprawl while simultaneously increasing utilization . Standardization is especially important where lower - level architectural decisions , such as networking and authentication , 4 # 236029 ©2013 IDC are concerned, but it is rapidly mo ving up the stack into areas such as messaging and service enablement. Key Cloud Computing Trends T he market for worldwide public IT c loud s ervices encompasses packaged application software, platforms, and infrastructure that adhere to eight specific crit eria — identified by IDC — that characterize a cloud service. Software as a service (SaaS) includes collaborative applications (such as messaging, conferencing, and team collaboration software) and business applications (such as CRM, ERP, financial, HCM, PLM, and SCM) delivered via the cloud services model. Revenue in the SaaS market was about $ 24.1 billion in 201 2 and is expected to increase at a compound annual growth rate (CAGR) of 20.8 % through 201 7 Platform as a service (PaaS ) includes application development and deployment tools such as application development software, application life - cycle management software, enterprise mashup and portal software, information management and data integration software, and middleware and bu siness process management software delivered via the cloud services model. Revenue in the PaaS market was about $3 .8 billion in 201 2 and is expected to increase at a CAGR of 29.7 % through 201 7 . Infrastructure as a service (IaaS) broadly includes compute r esources, storage resources, and system infrastructure software delivered via the cloud services model. Revenue in t he Public Cloud IaaS market was about $ 9.3 billion in 201 2 and is expected to increase at a CAGR of 2 7.2 % through 201 7 . Figure 1 provides a graphical view of the worldwide public IT cloud services market segmented by primary market . Vendor revenues associated with IaaS and PaaS account ed for a 3 5 % share of the overall market in 201 2 , which speaks to the immense value that o rganizations place on developing and deploying applications on public infrastructure. ©2013 IDC # 236029 5 FIGURE 1 Worldwide Public IT Cloud Services Segmented by Primary Market , 20 11 – 201 7 Source: IDC, 201 3 AMAZON WEB SERVICES During the late 1990s and early 2000s , as Amazon was emerging as the world ' s leading ecommerce company, internal business requirements necessitated that Amazon build out an application infrastructure that would support massive scale and reliability in the following areas: compute, parallel pro cessing, storage, content management, data management (relational and nonrelational databases) , transaction processing, messaging, queuing, payments, security, monitoring, and management . Competing IT objectives involving scalability and cost steered Amazo n down the path of service orientation . The services created during this IT transformation process ultimately laid the foundation for AWS. Figure 2 identifies the key services provided by AWS. 0 5,000 10,000 15,000 20,000 25,000 30,000 35,000 40,000 45,000 50,000 2011 2012 2013 2014 2015 2016 2017 ($ Billions) PaaS IaaS 6 # 236029 ©2013 IDC FIGURE 2 Amazon Web Services Source: Amazon, 201 3 Amazon ' s focus on driving costs out of the company's large - scale ecommerce operations led Amazon to move toward service orientation and exposing all resources as scalable and consumable services . This movement also ensured that the development culture at Amazon wou ld be aligned with modern development techniques and result in a platform that was flexible, agile, and extensible . This has resulted in a high degree of AWS API envy across the industry . From an AWS customer standpoint , this means it is easier to develop applications using AWS, easier to deploy preexisting applications on A WS , and easier to establish hybrid operations spanning AWS and private datacenters . ©2013 IDC # 236029 7 BUSINESS VALUE Study Demographics In early 2012, IDC interviewed 11 organizations that had deployed AWS . The organizations ranged from small and medium - sized companies to large r companies with as many as 1 6 0,000 employees . The organizations are based in North America , Europe , and Asia / Pacific and include representatives from real estate, banking, technology, media, sports , security, and management services industries . The interviews were designed to elicit both quantifiable information and anecdotes so that IDC could interpret the full impact of AWS on the se organization s . Table 1 summarizes the demographics of the study. TABLE 1 Study Demographics Category Average Employees 21,445 Virtual servers from AWS 1,232 A pplications being implemented with AWS 9.7 C riticality rating of applications deployed on AWS — from 1 ( low ) to 5 ( high) 4.5 End users of IT services — internal 1 , 3 72 End users of IT services — external a pplication users 2,230,248 Industries Real e state, b anking, t echnology, m edia, m anagement s ervices, s ecurity, s ports Geograph ies North America , Europe, Asia /Pacific Source: IDC, 201 3 The study base represents a broad range of experiences , with companies discussing applications ranging from a small internal ly developed application supporting eight users to a large commercial application with over 20 million customers . About half of the 11 companies are using AWS to deliver high - performance computing applications , one - third are supporting W eb applications , and one - quarter have big data applications. The use cases reviewed offered a variety of steady - state and variable - state workloads. 8 # 236029 ©2013 IDC FINANCIAL BENEFITS ANALYSIS Benefits Summary The organizations in the study selected AWS to develop, deploy , and manage the ir critical applications primarily because AWS offered the best scalability, time to market , and price . From the interviews , IDC was able to measure the impact of AWS . Overall, the organizations recognized annual financial benefits totaling over $5 million ( over $ 5 1 8,000 per application) from the following areas:  Reduced IT infrastructure and services costs . The most significant benefit comes from rehosting applications on AWS infrastructure due to lower capital and operational costs . This reduction in capex and opex accounted for a savings of nearly $ 276 ,000 per application per year . Companies were able to consolidate, integrate, and standardize their infrastructure .  Optimized IT staff productivity . By accelerating the application development and deployment process , au tomating application management, and switching to IaaS , IT staff are now 52% more productive , saving nearly $150,000 per application per year . I T staff are thus able to improve support of mission - critical operations .  Enhanced end - user productivity . End users benefited from fewer service disruptions and quicker recovery , re ducing downtime by 72% and saving nearly $32,600 per application per year.  Increased business benefit . Many of the companies are employing AWS to enable new business models and support revenue - generating applications and were able to increase annual revenu e by over $1 m i llion , which translates to more than $64, 000 in annual operating income. Figure 3 provides an aggregate view of these benefits. ©2013 IDC # 236029 9 FIGURE 3 Average Annual Benefits of Deploying Applications on AWS per A pplication Source: IDC, 201 3 Cost Reduction Companies today look to the cloud as a way to shift expenses from capital to operational budgets. All of the companies in the study not only shifted their budgets but also significantly reduced their costs and time to market for delivering these critical applications. In terms of annual budgets , they were able to replace $3.66 in capital costs with $1 .00 in new operational costs, namely Amazon EC2 costs . In this study , we assessed IT infrastructure savings resulting from migration to the cloud in the areas of server, storage, networking hardware and software , and server hosting services. On average, each company was able to reduce its annual infrastructure and services costs by nearly $ 276 ,000 per application in the following areas , as shown in Fig ure 4 , as a result of the shift from capital costs to operational costs.  Servers ( hardware and related software ) — i ncludes the annual capex for the physical servers replaced by A WS (average 400 servers replaced per customer) as well as the operating system and related software efficiencies realized by moving to the cloud environment (security, management , etc.)  Hosting and other services — includes savings in the areas of collocation services ( four of the companies had collocation services) and/ or managed services as a result of moving to the same level of services from A WS  Networking equipment and bandwidth — includes WAN equipment and savings from more efficient use of bandwidth $275,807 $146,355 $64,261 $32,566 0 100,000 200,000 300,000 400,000 500,000 600,000 ($) User productivity Operating income IT staff productivity Cost reduction: infrastructure and services Total = $518,990 10 # 236029 ©2013 IDC  Storage — includes savings from moving storage to the cloud , resulting in more efficient utilization and redundancy of storage assets and a 25% reduction in the overall storage cost per terabyte ( TB ) in use FIGURE 4 Annual Infrastructure and Services Cost Benefits of AWS per A pplication Source: IDC, 201 3 IT Sta ff Efficiency Our analysis focused on tracking a critical application through the costs associated with development, deployment, ongoing management , infrastructure , and staff to support the infrastructure . As discussed earlier, AWS had a significant impact on application development and deployment, reducing overall developer hours by 80% . This increased productivity of developers means that organizations can deliver applications to market faster as well as increase the volume of applicatio ns being developed. $190,658 $50,409 $21,114 $13,626 0 50,000 100,000 150,000 200,000 250,000 300,000 ($) Storage Networking equipment and bandwidth Hosting and other services Servers Total = $275,807 ©2013 IDC # 236029 11 Development and Deployment Efficiency An important area of consideration for this study was developer efficiency across the software development life cycle (SDLC) . In our conversations with AWS customers for this study and the projects we evaluated, we found mostly hybrid approaches to the SDLC where tasks were split across in - house systems and AWS . Although some customers performed all aspects of their development project on AWS, this was not the norm and is explained by sunk costs on t he part of customers, inertia, and caution due to the new technology and business models of cloud services. Figure 5 show s the improvements that we observed in developer efficiency across the SDLC . These findings should be interpreted as follows : A 500 % im provement in efficiency means that developers could perform tasks five times faster with AWS than with other in - house alternatives . A 200 % improvement in efficiency means that AWS enables developers to perform tasks twice as fast as other in - house alternatives. FIGURE 5 Comparison of Developer Efficiency with AWS and In - H ouse Alternatives Note : A 500% improvement in efficiency means that developers could perform tasks five times faster with AWS tha n with other in - house alternatives. Source: IDC, 201 3 The high scores received by AWS on development and testing were due to the availability, scope, and depth of AWS APIs . AWS APIs enabled developers to more effectively utilize services during application development , which reduced time spent writing additional custom code . The maturity of AWS also means that its services are well vetted and there fore lead to higher - quality applications with reduce d defects and less time spent resolving defects . While many platform vendors will claim that such benefits stem simply from the adoption of platform technologies, we believe that these developer benefits are closely tied to the capabilities of the cloud infrastructure . For 0 100 200 300 400 500 600 Development Testing Integration Deployment Total (Improved efficiency) 12 # 236029 ©2013 IDC example, the automated provis ioning, dynamic scalability, management, and monitoring that are part of AWS mean that the development of applications can be simplified because many key services that govern application behavior no longer hav e to be coded ; instead , they can simply be conf igured as part of deployment . This approach also helps explain why deployment efficiency is commensurate with development and testing efficiency. ©2013 IDC # 236029 13 Integratio n efficiency received a lower score than other life - cycle tasks but still was twice as efficient as alternative approaches . Integration involves legacy assets and potentially hybrid datacenter interoperability , making integration challenging . While the improvements in integration were still significant, these gains were not as large as those for other S DLC activities , reflect ing both the complexity of opening up and linking to applications not originally engineered for the W eb and the low incidence of integration tasks that we were able to measure. Post - Deployment Staff Productivity As with most technology , if you make something easier, quicker , and cheaper to do , you will do more of it ; so it goes , especially with application development . Because companies in the study could create applications with fewer staff hours , they tended to deliver more frequent upgrades or reallocate resources to create new applications that they had not previously planned . The net result was that they were able to generate more applications yet reduce the costs to develop and deploy by 25%. Post - deployment IT staff prod uctivity savings result primarily from the reduced infrastructure footprint , requiring less maintenance and support . The combined costs for server, storage , and network support are reduced by 68% , which includes the cost avoidance from not having to increa se staff to meet new business requirements . In addition, AWS management services reduced application management costs by another 70% . Figure 6 shows the annual post - deployment IT staff productivity benefits per application in terms of FTEs. 14 # 236029 ©2013 IDC FIGURE 6 Annual Post - D eployment IT Staff Productivity Benefits of AWS per A pplication Source: IDC, 201 3 Business Benefits The most significant impact on the business operations of the organizations we interviewed was the enhanced agility delivered by AWS . This time - to - market benefit is often cited as the key reason for adopting cloud services . Seven of eleven companies reported significant improvements in agility . Not all contributed to revenue. Four of 1.68 0.53 1.04 0.78 0.66 0.21 0.43 0.13 0.34 0.04 0.25 0.15 0.0 0.5 1.0 1.5 2.0 2.5 3.0 3.5 4.0 4.5 5.0 Other AWS (FTEs) Management savings Developers Server management Application management Storage management Network management 4.39 1.84 ©2013 IDC # 236029 15 these organizations were able to discuss how revenue - relate d agility improvements enabled new business models :  " We can get transactions quicker in our accounting software now . Our people are more productive . It ' s really seamless to the end user in that regard . They physically have more time to do that work . Estima ted additional annual revenue is $500,000+. "  " With AWS , we are able to launch some of the services instantaneously. It would take many months, if not a year or more , to build out that whole infrastructure from scratch . Estimated additional annual revenue is $2 million+ . "  " In half a year that we ' ve had this service on market…it ' s become almost our most popular service . I mean we ' re talking about millions of dollars in the last six months . Low millions so far . But we think that it ' s going to generate hundred s of millions over the life of this project . Estimated additional annual revenue is $3 million+. "  " Our ability to go to market with our new program . We would not have been able to get that out . Estimated additional annual revenue is $200,000 to $500,000 . " User Productivity Many companies opt for IaaS on an application - by - application basis and usually when faced with a new requirement . As businesses become more demanding and the stakes get higher , CIOs are concerned that their current resources cannot deliver on the agility, scalability , or robustness that the new application requires . The robustness or quality of service is often measured in unplanned downtime and is the number one reason companie s switch providers . In this study , 80% of the organizations reported that Amazon EC2 had reduced downtime and that they were able to reduce their downtime by 72% per user , saving roughly four hours per user per year. In other words, the companies interview ed were able to improve availability from 99. 4 9 5 % in their on - premises /hosted implementations to 99.9 75 % on AWS, increasing application availability by an average of 234 hours per user per yea r. Table 2 summarizes p roductivity i mprovements achieved with AW S . TABLE 2 User Productivity — Performance KPIs ( as Reported by Customers) Other AWS % Improvement Downtime events per year 2.82 2.00 29 H ours per year 7 . 755 4 . 12 75 Downtime hours per user per year 5.40 1.50 72 Availability (%) 99 . 495 99 . 975 95 Source: IDC, 201 3 16 # 236029 ©2013 IDC Total Cost Comparison By moving from on - premises or mixed on - premises and hosted solutions to AWS cloud services , organizations in our study were able to reduce the TCO for the average application by 7 2 % over a five - year life cycle . TCO savings include reducing development and deployment costs (by 80%) , application management costs (by 52% ) , and infrastructure support costs (by 56% ) and replacing $1.6 million in infrastructure costs with $302,000 in AWS costs . The five - year TCO is sho wn in Figure 7. 2014 UPDATE Since our last study in early 2012, Amazon EC2 and Amazon S3 haves introduced price reductions nearly 20 times across certain key instance types, sizes, and configurations, in some cases significantly lowering overall customer s pend. For example, Amazon EC2 Reserved Instances (RI) is a mechanism by which one - time fees are paid, and users in turn receive a significant discount on the hourly usage charge for that instance ( AWS says up to 71% lower than on - demand instances). AWS rec ently dropped the price of most Linux/Unix RI instance families by 27%. AWS has broadened what it calls its "free usage tier" - a starter tier for AWS beginners/trailers - to include most versions of Windows server, a very common configuration choice for proof - of - concept (POC) customers, as well as most flavors of Linux. AW S lowered prices in early 2012 for several instance sizes of standard storage, Relational Database Service (RDS), and Elasti C ache, and followed this action up four more times in 2012 an d 2013 with lower prices for most Amazon RDS. In addition, a key requirement for most users is multi - availability zone (AZ) for better availability and performance of transactional apps, and multi - node (for backup and redundancy), and AWS has cut its mult i - AZ charges to customers twice in the past 18 months, by an average of 19%. Prices for AWS Simple Networking Service (SNS), and Simple Workflow Service (SWS) have already been lowered once since 201 2 . AWS's express reason for lowering cost is that its sc ale and unique industry weight allow it to leverage OEM/ODM relationships for lower cost, custom - design software and hardware and utilities management systems for optimal consumption, and otherwise innovate and apply its first - mover learnings to pass savin gs along to customers. IDC estimated that if the 11 AWS customers we had interviewed in 2012 to support this study were to migrate to AWS today, they would experience their overall fees drop ping by an additional 21% ; lowering the five year TCO from $909,000 to $846,000. Its important to note that the other business value results reported in this w hite p aper do not take into account these new lower prices from AWS due to the timing of our AWS customer research. ©2013 IDC # 236029 17 FIGUR E 7 Five - Year TCO of AWS per A pplication Source: IDC, 201 3 Benefit s Increase O ver T ime Organizations in our study had been AWS customers for as few as seven months to as many as 5.3 years . While all customers had enjoyed positive returns on investment, there is a definite correlation between the length of time they have been AWS customers and their returns . This relationship between length of time using AWS and return is due to their leveraging the mo re optimized environment to generate more applications along a learning curve . At 36 months , the organizations are realizing $3.50 in benefits for every $1 .00 invested in AWS; at 60 months , they are realizing $8.40 for every $1 .00 invested. 0 500,000 1,000,000 1,500,000 2,000,000 2,500,000 3,000,000 3,500,000 Other AWS (pricing as of July 2012) AWS (pricing as of November 2013) ($) Development Deployment Application management Infrastructure management Infrastructure AWS fees 18 # 236029 ©2013 IDC ROI ANALYSIS I DC uses a discounted cash flow methodology to calculate the ROI and payback period . ROI is the ratio of the net present value ( NPV ) and discounted investment . Payback period is the point at which cumulative benefits equal the initial investment. IDC uses t he NPV of the savings and increased revenue over five years in calculating the ROI and payback period for the deployment. The NPV of the savings is determined by subtracting the amount that would have been earned by investing the original sum in an instrum ent yielding a 12% return (to allow for the missed opportunity cost that could have been realized using that capital). Table 3 presents IDC ' s ROI analysis for the deployment of AWS to replace on - premises or other hosting services . This ROI analysis constitutes a five - year view of the financial impact of AWS on a per - application basis. A detailed outline of IDC ' s standard ROI methodology is provided in the Appendix of this document . The five - year ROI analysis shows that on average, t he organizations in this study spent $286,000 per application on AWS and received $2.1 million per application in benefits for a n NPV of $1.8 million . The companies saw a payback period of seven months and an ROI of 626% . TABLE 3 Five - Year ROI Analysis Benefit (discounted) $2,078,626 Investment (discounted) $286,357 Net present value (NPV) $1,792,269 Return on investment (ROI) 626% Payback 7.1 months Discount rate 12% Note: The discount rate refers to the missed opportunity cost that could have been realized using that capital related to the average cost of capital + risk factor . Source: IDC, 201 3 The initial investment included the average total costs to purchase , deploy , and run services on AWS . Annual benefits include infrastructure savings, reduced IT labor support, added income , and improved productivity . Organizations in this study made an initial investment of $17,766 per application , which included the purchase and implementation costs for consulting services and the IT labor required for deploy ment . Based on that investment, the organizations realized average annual benefits of $584,752 per application . Over a five - year period , each company saw cumulative ©2013 IDC # 236029 19 savings of $2.5 million per application . Figure 8 presents the outcome of the ROI analysis in graphical form. FIGURE 8 Cash Flow Analysis of AWS per A pplication Source: IDC, 201 3 CHALLENGES AND OPPORTUNITIES Challenges Legacy System Integration Rehosting applications may require some reengineering, especially if the client side of the application requires a proprietary runtime and/or the application does not leverage Web services between the client and the server . Bridging to or integrating with server - side legacy syst ems is somewhat easier because the code can be more readily wrappered without having to rebuild parts of the application . Consequently, integration remains a challenge because the architecture and the modularity of legacy applications are highly variable. Our analysis in this paper seems to bear this out . Figure 5 shows a 200 % gain on developer productivity associated with integration , whereas development, testing , and deployment all showed productivity gains in the neighborhood of 500 % . While we - $17,766 - $74,510 - $74,510 - $74,510 - $74,510 - $74,510 $ - $518,990 $545,867 $577,680 $615,336 $665,887 $426,714 $898,072 $1,401,242 $1,942,067 $2,533,444 - 500,000 0 500,000 1,000,000 1,500,000 2,000,000 2,500,000 3,000,000 0 1 2 3 4 5 ($) (Year) Investment Benefits Cumulative cash flow 20 # 236029 ©2013 IDC have prese nted this issue as a challenge, the reality is that AWS still compares favorably with other alternatives in terms of integration and assembly due to the rich set of APIs , supported by AWS , that reduce the amount of code otherwise necessary to address most integration tasks. Extending the Software Development Life Cycle AWS has already instilled significant functionality across key areas of application development and deployment , including SDKs, application services, database s , networking, relational and non relational database s , identity and access, content delivery, and deployment. As AWS builds out its platform, enterprises will want to build and deploy more complex applications. This raises a question around how application life - cycle management (ALM) will be addressed. Application life - cycle management encompasses tools that support the full life cycle of an application , including requirements, team development, versioning, software quality assurance, project management , continuous integration, change mana gement, build management, and defect tracking . While there are open source tools that support some of these activities and AWS ' SDKs enable integration with some of today ' s leading ALM tools , providing and connecting these capabilities across hybrid enviro nments remain challenge s . While we don ' t expect AWS to broach the many issues that characterize complex ALM implementations, we do believe that as AWS matures, customers will increasingly look to AWS to align with the leading life - cycle tools and provide A PIs to better integrate development with deployment and ongoing operations with application development. D evelopment complexity demands higher levels of ALM adoption . The need for a more comprehensive approach to ALM creates a significant opportunity for A WS and would elevate the stature of AWS among medium - sized and large enterprises as they increasingly seek to integrate their on - premises IT activities with p ublic clouds. Opportunities Architecting Applications for the Cloud Our findings show that AWS has an outstanding track record regarding availability. However, service interruptions are inevitable regardless of whether applications are deployed on - premises , on AWS, or elsewhere. T o maximize the potential of cloud computing implementations, customers must evaluate the architecture of their applications. If availability is considered important, IDC recommends that organizations architect their applications across AWS A vailability Z ones in either active or passive ways that are commensurate with the lev el of availability required. These kind of architectural decisions are simply configuration based in AWS and easy to implement. Most IT shops fail to appreciate the level of sophistication that many cloud services , including AWS , provide and all too often approach deployment decisions without fully understanding how much more available and reliable their applications can be while still saving significantly on operational cost. ©2013 IDC # 236029 21 As organizations consider the choices that AWS provides around deploying applica tions, this is also the appropriate time to consider how applications should be scaled. Amazon M achine Image s (AMIs) are available as on - demand instances, as reserved instances, and as spot instances. The choice of how to deploy and how to scale , therefore , has a significant impact on application availability and cost. IDC advises organizations to make sure they understand the full range of deployment alternatives before commit ting to a ny particular deployment architecture. CONCLUSION This ROI analysis effe ctively validates what end users expect from cloud services , improving savings over the long term . The key areas where this ROI analysis is aligned with user expectations are as follows :  Enterprise - g rade availability across worldwide infrastructur e services for running any type of workload (transactional, MapReduce , high performance, W eb , or developer )  A highly cost - effective alternative to on - premises infrastructur e solutions that delivers significantly reduced IT system and management costs  Excep tional productivity and time - to - market advantages across the development, deployment, and management of applications due to the scope of AWS APIs  High levels of datacenter security, service security, and data security , including the following: Service Orga nization Controls 1 , 2 and 3 ( SOC ) report s , published under both the Statement on Standards for Attestation Engagements No.16 ( SSAE 16 ) and the International Standards for Assurance Engagement No. 3402 ( ISAE 3402 ) professional standards ( this audit replaces the Standards on Auditing Standards No. 70 [ SAS 70 ] Type II report ) ; authorization from the U.S. General Services Administration to operate at the Federal Information Security Management Act (FISMA) Moderate level; t he platform for applications wi th Authorities to Operate (ATOs) under the Defense Information Assurances Certification and Accreditation Program (DIACAP); ISO 27001 certification of AWS ' Information Security Management System (ISMS) covering its infrastructure, datacenters, and services ; s uccessfully validated as a Level 1 service provider under the Payment Card Industry (PCI) Data Security Standard (DSS); International Traffic In Arms Compliance (ITAR) compliance (AWS GovCloud [ US ] Region); Federal Information Processing Standard (FIPS) Publication 140 - 2 ; HIP A A ; Cloud Security Appliance (CSA) Consensus Assessment Initiative Questionnaire (CAIQ) , and Agency Authority to Operate (ATOs) under the Federal Risk and Authorization Management Program (FedRAMP) at the Moderate impact level. Ama zon ' s decision to develop AWS from the ground up to support Amazon's own massively complex IT needs as a Fortune 100 company provides a compelling reference model for how to architect cloud services . The size and scale of AWS also provide AWS with a high degree of market flexibility and ability to offer services at price points well beyond the reach of most very large enterprises or other cloud 22 # 236029 ©2013 IDC service providers . AWS has reduced its prices 40 times since 2006 , making AWS appealing to organizati ons of all sizes . APPENDIX IDC utilized its standard ROI methodology for this project. This methodology is based on gathering data from current users of the technology as the foundation for the model. Based on these interviews, IDC performs a three - step process to calculate the ROI and payback period: 1. Measure the savings from reduced IT costs (staff, hardware, software, maintenance, and IT support), increased user productivity, and improved revenue over the term of the deployment. 2. Ascertain the investmen t made in deploying the solution and the associated training and support costs. 3. Project the costs and savings over a five - year period and calculate the ROI and payback for the deployed solution. IDC uses the NPV of the savings and increased revenue over f ive years in calculating the ROI and payback period for the deployment. The NPV of the savings is determined by subtracting the amount that would have been earned by investing the original sum in an instrument yielding a 12% return (to allow for the missed opportunity cost that could have been realized using that capital). IDC bases the payback period and ROI calculations on a number of assumptions, which are summarized below: 1. Time values are multiplied by burdened salary (salary + 28% for benefits and over head) to quantify efficiency and manager productivity savings. 2. Downtime values are a product of the number of hours of downtime multiplied by the number of users affected. 3. The impact of unplanned downtime is quantified in terms of impaired end - user produ ctivity and lost revenue. 4. Lost productivity is a product of downtime multiplied by burdened salary. 5. Lost revenue is a product of downtime multiplied by the average revenue generated per hour. 6. The NPV of the five - year savings is calculated by subtracting the amount that would have been realized by investing the original sum in an instrument yielding a 12% return to allow for the missed opportunity cost. This accounts for both the assumed cost of money and the assumed rate of return. Because every hour of downtime does not equate to a lost hour of productivity or revenue generation, IDC attributes only a fraction of the result to savings. As part of our assessment, we asked each company what fraction of downtime hours to use in ©2013 IDC # 236029 23 calculating productivity savi ngs and the reduction in lost revenue. IDC then taxes the revenue at that rate. Further, because IT solutions require a deployment period, the full benefits of the solution are not available during deployment. To capture this reality, IDC prorates the ben efits on a monthly basis and then subtracts the deployment time from the first - year savings. Copyright Notice External Publication of IDC Information and Data — Any IDC information that is to be used in advertising, press releases, or promotional materials requires prior written approval from the appropriate IDC Vice President or Country Manager. A draft of the proposed do cument should accompany any such request. IDC reserves the right to deny approval of external usage for any reason. Copyright 2013 IDC. Reproduction without written permission is completely forbidden.