/
THE  BUSINESS CASE FOR THE  BUSINESS CASE FOR

THE BUSINESS CASE FOR - PowerPoint Presentation

lois-ondreau
lois-ondreau . @lois-ondreau
Follow
343 views
Uploaded On 2019-11-20

THE BUSINESS CASE FOR - PPT Presentation

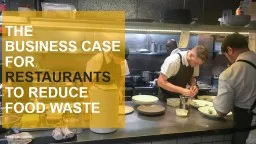
THE BUSINESS CASE FOR RESTAURANTS TO REDUCE FOOD WASTE Photo Lou Stejskal TARGET 123 By 2030 halve per capita global food waste at the retail and consumer levels amp reduce food losses along production and supply chains including postharvest losses ID: 765890

waste food advisor flw food waste flw advisor wri pizza director loss restaurants hut robertson kai lead weight scope

Share:

Link:

Embed:

Download Presentation from below link

Download Presentation The PPT/PDF document "THE BUSINESS CASE FOR" is the property of its rightful owner. Permission is granted to download and print the materials on this web site for personal, non-commercial use only, and to display it on your personal computer provided you do not modify the materials and that you retain all copyright notices contained in the materials. By downloading content from our website, you accept the terms of this agreement.


Presentation Transcript

THE BUSINESS CASE FOR RESTAURANTS TO REDUCE FOOD WASTE Photo: Lou Stejskal

TARGET 12.3By 2030 halve per capita global food waste at the retail and consumer levels & reduce food losses along production and supply chains, including post-harvest losses

SECRETARIAT

SECRETARIAT Co-Authored by WRI & WRAP Find the report at: Champions123.org

SPEAKERSEleanor MorrisHospitality and Food Service Special Advisor, WRAPSteven Packer Director of Supply Chain and IT, Pizza Hut UK Kai Robertson Lead Advisor, WRI, FLW Protocol Moderator Liz Goodwin Senior Fellow and Director, Food Loss and Waste, WRI

SPEAKERSEleanor MorrisHospitality and Food Service Special Advisor, WRAPSteven Packer Director of Supply Chain and IT, Pizza Hut UK Kai Robertson Lead Advisor, WRI, FLW Protocol Moderator Liz Goodwin Senior Fellow and Director, Food Loss and Waste, WRI

The business case for food waste reduction in restaurantsEleanor Morris Hospitality and Food Service Special Advisor , WRAP

Return on investment12 countries For each $1 invested $7 of financial benefit realised 114 restaurants

Investment was recouped70% in the first year of implementing a food reduction programme Investment was recouped 89% within two years of implementing a food reduction programme

All sites able to keeptotal investment to below$20,000 within three year period

The true cost of wasteVisible costsInvisible costsDisposal costsLost materials Energy costs Lost labour Lost water Other costs On average, the true cost of wasted materials is about 10 times the cost of disposal.

Financial benefit-cost ratios for restaurant sites

Key strategies: Measure Engage Staff Rethink inventory & purchasing prices Reduce overproduction Repurpose excess food

Image source: Nestlé

Investment recouped 89% within two years of implementing a food reduction programme For each $1 invested $7 of financial benefit realised All sites e to keep total investment to below All sites able to keep investment below $20,000 within 3 years You can have your cake, and eat it………….

Tools

SPEAKERSEleanor MorrisHospitality and Food Service Special Advisor, WRAPSteven Packer Director of Supply Chain and IT, Pizza Hut UK Kai Robertson Lead Advisor, WRI, FLW Protocol Moderator Liz Goodwin Senior Fellow and Director, Food Loss and Waste, WRI

Pizza Hut Restaurants Food Waste Context 250 Restaurants across the UK Kitchen preparation waste measured at ingredient level for many years: Weekly inventory counts Purchases tracked by restaurant by ingredient Every item sold can be broken down to ingredient via recipe ‘Expected use’ compared to ‘actual use’ to derive weekly wastage figures for every restaurant Includes inedible parts (relatively immaterial for us) No visibility of front of house or overall food waste prior to 2016 Since 2016: Segregated food waste collections in all restaurants (all going to AD if properly segregated, controlled combustion if incorrectly put into general waste) Collaborative project with WRAP to get accurate weight data for 50%+ of food waste collections Partnership with Winnow to measure front of house food waste in 3 areas - pizza buffet, unlimited salad bar and plate waste Introduction of redistribution scheme for surplus buffet pizza Buffet and salad bar range decisions based upon wastage

Pizza Hut Restaurants Food Waste Current state of play Overall measured food waste (based upon weighed food collection) c11% of food purchases by weight Kitchen prep waste c2% Pizza buffet waste c1% Salad bar waste c1% Plate waste c7% Challenges Restaurant segregation practices variable – unknown amount of food going into general waste stream and therefore unrecorded Site specific measurement of front of house waste is both expensive and operationally problematic across 250 locations with varying levels of employee engagement Plate waste solutions likely to require changes to consumer behaviour which may conflict with brand proposition

SPEAKERSEleanor MorrisHospitality and Food Service Special Advisor, WRAPSteven Packer Director of Supply Chain and IT, Pizza Hut UK Kai Robertson Lead Advisor, WRI, FLW Protocol Moderator Liz Goodwin Senior Fellow and Director, Food Loss and Waste, WRI

Overview of Food Loss and Waste Accounting and Reporting Standardfor RestaurantsFebruary 14, 2019Kai Robertson, Lead Advisor, FLW Protocol World Resources Institute

Standardized Way to Summarize“… it gives us a clear, unambiguous way for talking about food waste.”“… consistent language to use … and standard ways to measure and report.” The FLW Standard is helping companies and others measure and share data A Common Language Practical Guidance

’s major suppliers Case studies on using the FLW Standard An increasing number of companies and others are measuring food loss and waste (just a sampling) Kellogg Company: Food Waste In Global Manufacturing Operations Tesco’s Operations in the United Kingdom: Food Waste in Stores and Depots Delhaize America’s Operations in the United States: Food Waste in Stores and Distribution Centers Nestlé Dairy Factories in Pakistan: Losses Across the Value Chain Cranswick Gourmet Pastry’s Operations: Quantifying Food Waste From a Single Factory Estimating Quantities and Types of Food Waste at the City Level IKEA: “Food is Precious” Food Waste Initiative Courtauld 2025 U.S. Food Loss and Waste 2030 Champions (downloadable @ www.FLWProtocol.org)

12 months (collect data weekly) Food Inedible parts Animal Feed Biomaterial/ processing Co/anaerobic digestion Compost/aerobic Controlled combustion Land application Landfill Not harvested Refuse/discards Sewer There is no packaging associated with product produced for sale. Weight of product packaging is excluded from the weight of FLW . Example of how to use the FLWS common language: Pizza Hut UK Food category = All food purchased and sold Lifecycle stage = Restaurants (kitchen and plate waste) Geography = United Kingdom Organization = 260 restaurants NOTE : All destinations (other than sewer) are in scope as all material not sold or eaten is included. However, food waste only goes to anaerobic digestion or controlled combustion (as marked with a green check). = in scope but no material to this destination

December 2016 through end of January 2019 Food Inedible parts Animal Feed Biomaterial/ processing Co/anaerobic digestion Compost/aerobic Controlled combustion Land application Landfill Not harvested Refuse/discards Sewer Weight of food product packaging is excluded from the weight of food waste 4 Food category = All pre-consumer food and retail packaged beverages only 2, 3 Lifecycle stage = Direct operations (Customer and Co-worker Restaurant, Bistro, Swedish Food Market, Cafe) Geography = Belgium, Switz., Czech Republic, Denmark, Great Britain, Hungary, Italy, Netherlands, Norway, Poland, Sweden and US Organization = 247 out of 423 total stores 1 Note 1 : IKEA considers material sent to any destination listed in the FLW standard to be food waste. While all destinations are included within IKEA’s scope of reporting, food waste actually goes to only some of these destinations. These vary by store depending on available food waste collection options. Note 2 : Scope does not include any unpackaged or restaurant/café/bistro beverages Note 3 : Scope does not include food provided to customers as samples Note 4 : Scope does include weight of packaging for retail packaged beverages within the Swedish Food Market Example of how to use the FLWS common language: IKEA

Steps to take in measuring and reporting on FLWWebinars and video clips archived at www.FLWProtocol.orgWhy quantify?What to quantify How to quantify? Reporting

Where to find guidance? @ www.FLWProtocol.org You can download A customizable visual to summarize the scope of an FLW inventory A summary of requirements in the FLW Standard A sample reporting form Key terms and definitions in the FLW Standard Guidance on quantification methods

WRAP’s guidance for hospitality and foodservice sector (built on FLWS)

www.flwprotocol.orgCONTACT US WITH ANY QUESTIONSKai Robertson, Lead Advisor, FLW ProtocolWorld Resources Instituterobertson.kai@gmail.com

Q&APhoto by: tedeytan

SPEAKERSEleanor Morris Eleanor.Morris@wrap.org.ukHospitality and Food Service Special Advisor, WRAP Steven Packer Steven.Packer@phr.co.uk Director of Supply Chain and IT, Pizza Hut UK Kai Robertson robertson.kai@gmail.com Lead Advisor, WRI, FLW Protocol Moderator Liz Goodwin Liz.Goodwin@wri.org Senior Fellow and Director, Food Loss and Waste, WRI

THANK YOU Photo by: Senior Airman Tony R. Ritter