/
The declining middle class: a further analysis The proportion of emplo The declining middle class: a further analysis The proportion of emplo

The declining middle class: a further analysis The proportion of emplo - PDF document

lois-ondreau
lois-ondreau . @lois-ondreau
Follow
410 views
Uploaded On 2016-11-15

The declining middle class: a further analysis The proportion of emplo - PPT Presentation

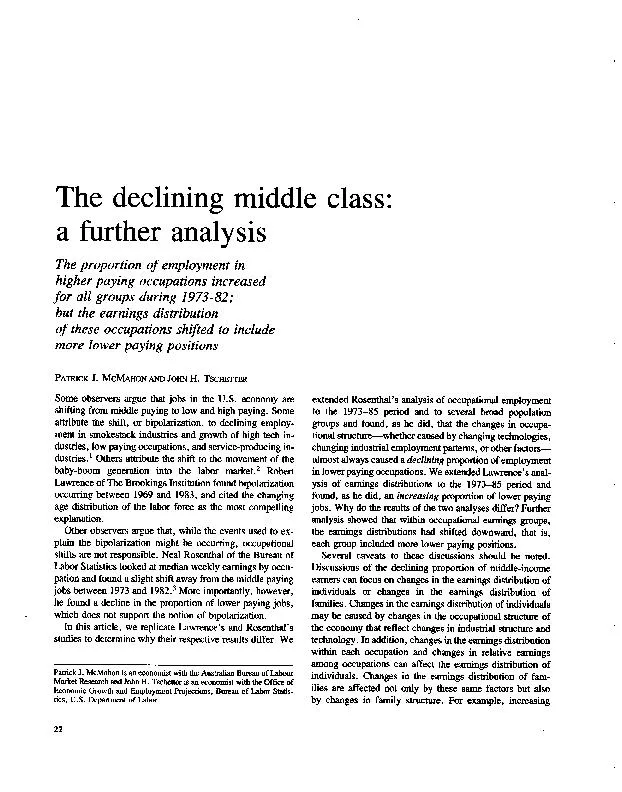
numbers of dualearner families can lead to an increase in the proportion of families with high earnings and increasing numbers of singleperson households can lead to an increase in the proportion of ID: 489018

numbers dual-earner families can

Share:

Link:

Embed:

Download Presentation from below link

Download Pdf The PPT/PDF document "The declining middle class: a further an..." is the property of its rightful owner. Permission is granted to download and print the materials on this web site for personal, non-commercial use only, and to display it on your personal computer provided you do not modify the materials and that you retain all copyright notices contained in the materials. By downloading content from our website, you accept the terms of this agreement.


Presentation Transcript

The declining middle class: a further analysis The proportion of employment in higher paying occupations increased for all groups during 1973-82; but the earnings distribution of these occupations shifted to include more lower paying positions PATRICK J. MCMAHON AND JOHN H. TSCHETTER Some observers argue that jobs in the U.S. economy are shifting from numbers of dual-earner families can lead to an increase in the proportion of families with high earnings and increasing numbers of single-person households can lead to an increase in the proportion of families with low earnings. Issues of the debate Of the many issues on structural and technological change, the one that currently attracts considerable attention and concern is the changing employment patterns-the em-ployment decline in large heavy manufacturing industries and in blue-collar occupations, and the employment in-crease in high technology manufacturing and service-producing industries and in white-collar and service occupa-tions. For example, 43 percent of the full-time wage and salary workers were employed in blue-collar and farm occu-pations in 1973, compared with only 35 percent in 1982. Apprehension about these changes is widespread. In many countries, rising unemployment is considered the most striking social-perhaps even political-aspect of this structural change. Joyanna Moy has shown that the U.S. economy has proved to be more dynamic than most others, and so the alarm is less about a lack of jobs than about the growing proportion of "wrong types" of jobs .4 The focus of the debate on structural change in the United States has been on the apparent loss of middle earnings jobs, which some argue have been replaced by both low and high earnings jobs. The debate has become more complicated because addi-tional explanations of the apparent bipolarization have been offered and bipolarization is thought to be affecting different population groups unequally. According to Lawrence, men are believed to have borne the brunt of bipolarization; women have not even experienced bipolarization.s Further, Lawrence says the entry of the baby-boom generation into the labor market and the resulting changes in the age distri-bution of the work force provide a more powerful explana-tion of bipolarization. One major problem in this debate is the type of evidence offered. Some put forth anecdotal evidence. Others offer "hard" evidence, but for only a few industries or occupa-tions-for example, the rapid growth of a few very low paying occupations and a few very high paying occupations in the service sector combined with the decline of a few middle paying occupations in the goods-producing sector. However, the evidence usually becomes less compelling when a broader focus is taken.b A few offer systematic or comprehensive data; these observers, however, cannot agree on who comprises the middle class over time. Some use occupations to define the middle class; others use earn-ings. In this analysis, we use one data base for both the occupational and earnings approaches, and then reconcile the conflicting findings. Rosenthal's occupational approach Like Rosenthal, we analyzed the declining middle-class thesis using data from the Current Population Survey on usual weekly earnings and on employment of full-time wage and salary workers by detailed occupation. The analysis identifies the effect of changes in occupational structure on the distribution of full-time workers among three earnings groups: low, middle, and high. We revised Rosenthal's original analysis to ensure a consistent data base for our analysis.? Because of substantial changes in occupational definitions introduced in 1983, shifts between 1982 (and earlier years) and 1985 cannot be measured. To test the effect of changes in occupational structure on the distribution of workers into low, middle, and high earn-ings groups between the beginning and ending years, we (1) arrayed the detailed occupations in the ending year by usual weekly earnings and arranged them into thirds (bot-tom, middle, or top), with each third containing the same number of occupations; (2) summed the number of workers in the occupations in each third and calculated a percent distribution of the employment; and (3) arrayed employment in the beginning year for each occupation in the same order as in the ending year, and calculated the beginning-year percent distribution for each third. Consequently, an occu-pation was in the same third in the beginning year as it was in the ending year. Rosenthal analyzed 416 detailed occupa-tions for 1973 and 1982; we analyzed 504 occupations for 1983 and 1985. The 1982, 1983, and 1985 data are annual averages; the 1973 data relate only to May. All full-time workers. If bipolarization were occurring, the proportion of total employment in the middle third would decline between 1973 and 1982, and the bottom and top thirds would show an increase. The following tabulation shows the distribution of employment of full-time wage and salary workers in 1973 and 1982 by usual median weekly earnings in 1982, based on the occupational approach: Usual Percent weekly distribution earnings of employment 1973 1982 Top third ................ $382 to $773 25.2 29.0 Middle third .............. 264 to 382 34.2 32.5 Bottom third ............. 71 to 264 40.6 38.5 The share of employment in the top third increased appre-ciably, the bottom share decreased, and the middle de-creased, but less than the bottom third. Based on the declin-ing proportion of employment in the bottom third, we agree with Rosenthal's conclusion that changes in occupational structure alone from 1973 to 1982, whether caused by tech-nological change, the shift from goods- to service-producing industries, or other factors, do not support the notion of bipolarization. The following tabulation shows our findings on the distri-bution of employment in 1983 and in 1985 by usual median MONTHLY LABOR September 1986 o Further Analysis of Declining Middle Class weekly earnings in 1985, based on the occupational ap- proach: Usual weekly earnings Per distrib of empl cent ution oyment 1983 1985 Top third ................ $439 to $931 29.5 29.7 Middle third .............. 301 to 439 33.6 34.1 Bottom third ............. 100 to 301 37.0 36.3 The top and middle thirds increased, and the bottom third decreased. The changes in occupational structure since 1983 also are contrary to the bipolarization thesis. female counterparts. For each group, the share of employment in the top third increased several percentage points between 1973 and 1982. However, only for women did the share of employment increase in the middle third. Men accounted for the largest decline in the share of middle paying occupations. Only younger workers did not experience a decline in the share of employment in the bottom third. Despite the varying pat-terns among the groups, the shifts in occupational structure of full-tune workers do not support the notion of bipolariza-tion, where employment in both the lower paying and higher paying occupations grows as a percent of total employment, while employment in middle paying occupations declines. Population groups. Have blacks, whites, men, women, youth, and adults all benefited from these occupational trends which have caused a declining proportion of lower paying occupations? To answer this question, we need to identify the changes in occupational structure of full-time workers in the three earnings groups separately for each of the six population groups. To do this, we (1) summed sep-arately by population group the number of workers in each occupation for 1973 and 1982 according to Rosenthal's 1982 rankings for total employment by occupation, and (2) calculated the percent distribution of employment by usual weekly earnings class for each population group. The occu-pational structure varies considerably by population group and the respective structures are changing. More than half of the youth, women, and blacks who worked full time were in low paying occupations in 1982. (See table 1.) Nearly 40 percent of the men who worked full time were in high paying occupations, compared with only 14 percent of their Table 1. Employment distribution for selected groups by earnings, based on the occupational approach, 1973 and 1982 [In percent] 1973 1982 Youth, 16-24 years: Top third ........................................... 11.4 14.5 Middle third ......................................... 32.3 29.2 Bottom third ........................................ 56.3 56.3 Adults, 25 years and older: Top third ........................................... 28.6 32.0 Middle third ......................................... 34.6 33.2 Bottom third ........................................ 36.8 34.7 Men: Top third ........................................... 34.9 39.0 Middle third ......................................... 39.3 36.4 Bottom third ........................................ 25.8 24.6 women: Top third ........................................... 7.5 13.9 Middle third ......................................... 24.9 26.7 Bottom third ........................................ 67.6 59.4 Whites: Top third ........................................... 26.8 30.6 Middle third ......................................... 34.6 33.0 Bottom third ........................................ 38.6 36.4 Blacks: Top third ........................................... 10.6 15.3 Middle third ......................................... 31.2 29.9 Bottom third ........................................ 58.2 54.8 Lawrence's earnings approach In Lawrence's analysis of the declining middle-class thesis, he distributed full-time workers into earnings classes that are a fixed or constant percentage of the median weekly earnings for all full-time workers. With this approach, Lawrence did find evidence of bipolarization between 1969 and 1983.8 He said the most compelling explanation for the findings lies in demographic factors, not declining employ-ment in smokestack industries or increasing employment in service industries. Further, he found the shifting age distri-bution to be the most important demographic factor. The major difference between the occupational and earn-ings approaches is how the bottom, middle, and top earnings classes are tracked over time. In the occupational approach, one assumes that the "class" of occupations is stable over time. Thus, we only have to determine to which class an occupation belonged for a given year. In the earnings ap-proach, one assumes that earnings levels which divide classes of workers are a fixed or constant percentage of the median weekly earnings for all full-time wage and salary workers. Thus, we only have to calculate the earnings groups for a given year. We replicated elements of Lawrence's methodology for the 1973-85 period.' (Because of the changes in occupa-tional definitions in 1983, it is not possible to calculate the 1969-83 shifts with the occupational approach.) Like Lawrence, we used the cps data on usual weekly earnings of full-time wage and salary workers. To measure the changes in employment distribution by earnings groups between 1973, 1982, and 1985, we (1) arrayed the full-time workers in 1982 by usual weekly earnings and arranged them into thirds (bottom, middle, and top), with each third containing about the same number of workers; (2) assumed that the earnings level (or brackets) which divide the earnings groups are the same percentage of the median weekly earn-ings for full-time workers in both 1973 and 1985 as in 1982; and (3) arrayed the workers in the respective earnings classes in 1973 and in 1985 and calculated the distribution for each class. (The median usual weekly earnings of full-time workers used here are $152 for 1973, $300 for 1982, and $349 for 1985.) If bipolarization were occurring, the proportion of total employment in the middle third would show a decline over time and the bottom and top thirds would show increases. The following tabulation shows the distribution of employ-ment in 1973, 1982, and 1985 by usual weekly earnings in 1982, based on the earnings approach: Usual weekly Percent distribution of employment earnings 1973 1982 1985 Top third ........... Over $385 33.3 33.5 32.6 Middle third ......... $239 to $385 34.8 33.5 31.7 Bottom third ........ Under $239 31.9 33.1 35.7 The shifts over the 1973 to 1982 period support the notion of bipolarization-declining employment share for the mid-dle third, increasing shares for the bottom and top thirds. During the 1983-85 period, only the share for the bottom third increased; the shares for both the middle and top thirds decreased. While the shifts for the entire 1973-85 period do not support the bipolarization thesis because the top third decreased, they are of considerable concern because they show an increasing proportion of low paying jobs and a declining proportion of middle paying jobs. Reconciling the findings The most striking difference between the occupational and earnings approaches is the declining employment share in the bottom third with the occupational approach (1.9 percentage points), but an increasing share with the earnings approach (1.2 percentage points). To reconcile these con-flicting findings, the two methods were combined. We (1) calculated for each detailed occupation the employment distribution by usual weekly earnings class in both 1973 and 1982, where the earnings class is defined by the earnings approach; (2) aggregated the individual occupations accord-ing to their rankings in the occupational approach; and (3) calculated the percentage distribution with the low, mid-dle, and high paying occupations by earnings class. As shown in the following tabulation, there has been a change in the earnings distribution of occupations, a down-ward shift: Occupational approach Earnings approach 1973 Top Middle Bottom All full-time workers .......... 33.3 34.8 31.9 Top third ................. 68.1 25.4 6.5 Middle third ............... 35.9 43.3 20.7 Bottom third .............. 9.6 33.4 57.0 1982 All full-time workers .......... 33.5 33.5 33.1 Top third ................. 63.8 27.2 9.0 Middle third ............... 34.5 42.1 23.4 Bottom third .............. 9.7 30.9 59.4 Within those occupations ranked in the top third, the proportion of wage and salary workers who would fall in the top earnings category declined over the 1973-82 period, while the proportion of workers in the middle and bottom earnings categories increased. And different patterns hold for each group of occupations. Within those occupations ranked in the middle third, the proportion of wage and salary workers in the top and middle earnings category declined over the 1973-82 period, while the proportion in the bottom earnings categories increased. Within those occupations ranked in the bottom third, the proportion of wage and salary workers who would fall in the middle earnings cate-gory declined, while the proportion in the top and bottom earnings categories increased. There are many possible explanations for the changes in earnings distribution within the occupational groupings. Un-fortunately, sufficient data are not available to evaluate the impact of individual factors, and it is likely that there would be interactions among the factors. The following discussion highlights possible explanations for the changes. The downward shift might be an experience or tenure effect. Three elements are required to make this point. First, earnings within an occupation are positively related both to occupational tenure (length of time in the occupation) and to job tenure (length of time with the current employer). '° Second, women, on average, have less experience or tenure then men within individual occupations; younger workers have less experience than older workers. Third, a greater percentage of the full-time workers in 1982, compared with 1973, were under age 35, and a greater percentage were women. Thus, the younger, more female 1982 work force, compared with the 1973 work force, implies less experience or tenure within individual occupations and, thus, smaller earnings. For example, there was a dramatic increase in the percentage of high paying jobs which were held by women over the period, from 11 percent in 1973 to 19 percent in 1982. Such a large change suggests a significantly different tenure mix in the high paying occupations. Similar but less dramatic changes occurred for the middle and low paying occupations. The explanation for the changing earnings distributions within the occupational groupings might be a cohort effect. According to Richard Freeman, Robert Lawrence, and others, the baby-boom generation is so large that the earn-ings within the generation are depressed when compared with other generations." If their thesis is valid, then the changing mix of generations within the work force that began in the early 1970's would have had a negative effect on the earnings distributions. Lawrence found this to be the most compelling explanation. The changes in earnings distributions within occupations might be an industry effect. Of the 416 occupations in the 1982 analysis, 274 had full-time workers in both the goods-and service-producing industries. The median usual weekly earnings were higher in goods-producing industries for 181 of those occupations. The absolute difference in earnings across the 274 occupations was $78 (the difference without 25 MONTHLY LABOR REVIEW September 1986 e Further Analysis of Declining Middle Class regard to sign). Most earnings studies only compare the median weekly earnings or hourly earnings of industries, not the occupational earnings by industry. The changes in employment are sensitive to the econ-omy's movement through the various stages of a business cycle. The 1973-82 shifts occurred as the economy moved from a business cycle peak to a trough. The entry-level earnings for most occupations may have been depressed when compared with 1973 because 1982 was the low point of the business cycle. Finally, in response to innovations, international compe-tition, cost consciousness, or other demand-oriented factors, companies might have made some significant changes in organizational structure. For example, they may have re-duced the levels of management; substituted entry and mid-level personnel for senior personnel; and contracted for goods and services, rather than providing similiar services with inhouse staff. At some point, such changes would affect the earnings distributions of individual occupations. Part-time workers At some point, the potential substitution of part-time workers for full-time workers must be considered when examining trends in the number of middle-class workers. (Rosenthal's findings did not change when part-time work-ers were included in his original analysis.) Substitution could consist of long-term, secular trends (such as busi-nesses expanding working hours or employers accommodat-ing workers seeking part-time work) or it could be a cyclical phenomenon, for example, decreasing work hours during a recession as demand slackens. The percentage of all employed persons working part time is indicative of these phenomena. The following tabu-lation shows the proportion of workers on full-and part-time schedules, selected years, 1973-85: 1973 1982 1983 1985 Full-time ................... 83.0 79.5 79.7 81.0 Part-time for economic reasons . 3.0 6.2 6.2 5.2 Voluntary part-time ........... 14.0 14.3 14.1 13.8 The percentage of employed persons voluntarily working part time has changed little over the last 12 years; the per-centage working part time for economic reasons has fluctu-ated with the movement of the economy through business cycles. To estimate the impact of part-time employment on de-tailed occupations by usual weekly earnings class, we (1) arrayed the detailed occupations in 1985 by the usual weekly earnings of full-time workers and arranged them into thirds; (2) summed total workers, full-time workers, and part-time workers in each third and calculated the respective distributions of employment; and (3) arrayed the total, full-time, and part-time workers for each occupation in the same order as in 1985, and calculated the respective 1983 distri-butions. (The data do not permit distinguishing between types of part-time workers.) The following tabulation shows the distribution of total, full-time, and part-time employ-ment in 1983 and 1985, based on occupational earnings: Total Full-time Part-time 1983 1985 1983 1985 1983 1985 Top third ....... 25.2 25.6 29.5 29.7 7.5 7.4 Middle third ..... 30.2 31.0 33.6 34.1 16.5 17.3 Bottom third .... 44.6 43.5 37.0 36.3 76.1 75.3 The share of middle earners increased slightly for each distribution. Part-time workers were certainly concentrated in occupations ranked in the bottom third; but the share of part-time workers in the bottom third declined over the period. We can conclude from this calculation that the patterns of occupational shifts whether measured in terms of all work-ers, full-time workers, or part-time workers are comparable. Therefore, the substitution of part-time workers for full-time workers is not a valid explanation for the declining propor-tion of workers in low paying occupations. Two STUDIES OF THE DECLINING MIDDLE-INCOME thesis were analyzed to put them on equal footing. The original studies were based on different periods as well as different ap-proaches. Our reconcilation showed that there was a signif-icant change in the earnings distribution in all three occupa-tional earnings groups-top, middle, and bottom-between 1973 and 1982. One should be cautious in applying these findings to the future because we were not able to identify the cause of the changing earnings distributions. And the trends for some of the possible variables offered as explanations will be consid-erably different during the next decade, compared with the past decade. For example, according to BLS' labor force projections, the 1995 labor force will be older and more experienced than the current labor force. 12 Thus, if tenure and experience were the proper explanation for the 1973-82 earnings shifts within occupations, then the shifts might reverse during the next decade. However, the recent trends for the cohort effect-the presence of the baby-boom gener-ation in the labor market-will continue through the next decade. El -FOOTNOTES- AcKNowl.womENr: The authors thank Robert Z. Lawrence of The Brook-ings Institution and Neal H. Rosenthal of the Bureau of Labor Statistics for their helpful comments. 1R. Kuttner, "The Declining Middle," The Atlantic Monthly, July 1983, pp. 60-72; L. S. Thurow, "The Disappearance of the Middle Class," The New York Times, Feb. 5, 1984, p. F3; B. Steinberg, Deindustrialization and the Two Tier Society (Am-ao, Industrial Union Department, 1985); and M. Harrington and M. Levinson, "The Perils of a Dual Economy-A Growing Trend in the American Occupational Structure," Dissent, Fall 1985, pp. 417-26. The intellectual stimulus to the debate initially came from B. Bluestone and B. Harrison, The Deindustrialization of America (New York, Basic Books, Inc., 1982). Proponents of the disappearing middle class have since construed the decline in employment in the smokestack and goods-producing industries along with a simultaneous growth in the high tech and service-producing industries as synonymous with a bipolarization of the earnings structure. They often point to the differential growth rates of employment in a small number of occupations identified with these indus-tries. The argument is loose and no evidence to support a bipolarization in the earnings distribution arising from shifts in the occupational structure has ever been published. RRobert Z. Lawrence, "Sectoral Shifts and the Size of the Middle Class," Brookings Review, Fall 1985, pp. 3-10. 3Nea1 H. Rosenthal, "The shrinking middle class: myth or reality?" Monthly Labor Review, March 1985, pp. 3-10. 4Joyanna T. Moy, "Recent trends in unemployment and the labor force, 10 countries," Monthly Labor Review, August 1985, pp. 9-22. SLawrence, ,SeCtoral Shifts." 6Rosenthal, "The shrinking middle class." Rosenthal examined the link-ages between several phenomena-declining employment in smokestack industries, rapid growth of service industries, and so forth-on earnings distribution. He found that, in each instance, when comprehensive data were reviewed, the impact of each phenomenon on the earnings distribution was either negligible or nonexistent. 7Rosenthal's data were recalculated for two reasons. First, BLS periodi-cally revises its procedures for estimating median weekly earnings. The median weekly earnings in this article for the detailed occupations are estimated based on $10 centered intervals. Data for the median weekly earnings of full-time workers are based on the "true" median of the sample. The medians are revised because earnings tend to be clustered at certain points, usually around $50 intervals. This clustering can affect the esti-mated changes in median earnings. Second, the May 1973 data used were revised to include only those responding to the usual weekly earnings question. Rosenthal included all respondents in his calculation. This second revision was necessary for subsequent analysis in this article. The two revisions had a very slight impact, certainly not a qualitative impact. sIawrence, "Sectoral Shifts." 9Lawrence's calculations involved four steps: he (1) centered the earn-ings of the middle class around the median usual earnings of men ($379) as of 1983; (2) calculated the 1983 employment distribution of full-time workers by usual weekly earnings class; (3) centered the middle class for 1969 around the median usual weekly earnings of men in 1969 ($142) and assumed the earnings brackets were the same percentage of male medium weekly earnings in both 1969 and 1983; and (4) calculated the 1969 em-ployment distribution using the 1969 earnings class. The usual weekly earnings for Lawrence's middle class were $250 to $499 in 1983, and $94 to $187 in 1969. Between 1969 and 1983, the change in male weekly earnings and change in the Consumer Price Index were nearly equal. Because of his approach, Lawrence might have overstated the decline in the proportion of workers in the bottom earnings group. First, he centered his middle class about the median weekly earnings of men in both 1969 and 1983. He might have centered his middle class about the median weekly earnings for all full-time workers, as we have done in our analysis. Thus, his middle class is not divided evenly between workers with earnings above and below the median for all full-time workers. Further, he uses the male median weekly earnings over time to establish the earnings levels which divide the classes. We used total median weekly earnings. If he had used the median weekly earnings for all full-time workers, the earnings levels which divided the middle and lower earnings groups would have been $10 higher in 1983. With his approach (male earnings), the proportion of workers in the bottom third declined 3 percentage points; with our approach (full-time workers' earnings), the proportion of workers would have in-creased slightly. Thus, his results would have been qualitatively different with a different median. The earnings approach (and the occupational approach) was not sensitive to the boundaries chosen to divide the classes of workers or to the number of classes considered. The middle might have been represented by 50 per-cent of the work force; shifts between 3, 4, or 10 classes might have been considered. t0The literature on earnings is extensive, but usually focuses on earnings differences by sex or race. Recent research by the BLS on earnings differ-ences between men and women was published in a series of articles in the June 1984 Monthly Labor Review. In one of the articles, Earl Mellor showed that women receive less pay than men in almost all occupational groups which employ both men and women. For most jobs, full-time usual weekly earnings of women in 1982 were 60 to 80 percent of those of men. Readers should be wary of interpreting these differences as evidence of discrimination for many of the reasons discussed by Mellor. t'See Lawrence, "Sectoral Shifts"; Richard B. Freeman, "The effect of demographic factors on age-earnings profiles," Journal of Human Re-sources, 14, 1979, pp. 289-318; Finis Welch, "Effects of cohort size on earnings," Journal ofPolitical Economy 87, 1979, pp. 565-98; and Louise B. Russell, The Baby Boom Generation and the Economy (Washington, The Brookings Institution, 1982). r2Howard N Fullerton, Jr., "The 1995 labor force: BLS' latest projec-tions," Monthly Labor Review, November 1985, pp. 17-25.