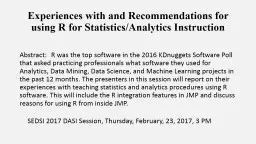
Abstract R was the top software in the 2016 KDnuggets Software Poll that asked practicing professionals what software they used for Analytics Data Mining Data Science and Machine Learning projects in the past 12 months The presenters in this session will report on their experiences ID: 549939
Download Presentation The PPT/PDF document "Experiences with and Recommendations for..." is the property of its rightful owner. Permission is granted to download and print the materials on this web site for personal, non-commercial use only, and to display it on your personal computer provided you do not modify the materials and that you retain all copyright notices contained in the materials. By downloading content from our website, you accept the terms of this agreement.
Slide1
Experiences with and Recommendations for using R for Statistics/Analytics Instruction
Abstract:
R was the top software in the 2016
KDnuggets
Software Poll that asked practicing professionals what software they used for Analytics, Data Mining, Data Science, and Machine Learning projects in the past 12 months. The presenters in this session will report on their experiences with teaching statistics and analytics procedures using R software. This will include the R integration features in JMP and discuss reasons for using R from inside JMP.
SEDSI 2017 DASI Session, Thursday, February, 23, 2017, 3 PMSlide2
Experiences with and Recommendations for using R for Statistics/Analytics Instruction
“Using JMP with R”
David Stephan
Two Bridges Instructional Technology
david@TwoBridgesIT.com
SEDSI 2017 DASI Session, Thursday, February 23, 2016, 3 PMSlide3
Why?!!
Instructional Reasons
Curricular Reasons
Career/Job Placement Considerations
Disclaimer: May not be for you or your studentsSlide4
Possibly Your Context?
My students are general business students
My students seek managerial, not technical careers
My school can afford JMP
My school is non-residential and/or has many distance learnersSlide5
Is Quality of Help Available a Concern?Not all HELP is created equal!Slide6
Do Your Students Need This?Slide7
Why Not Just JMP?
My program has a more “technical” bent, even though we are teaching future mgrs.
Not what the “cool kids” use
Does JMP do
method-of-your-choice
?
Job placements require “R experience”Slide8
Why Not Just R?“Let a thousand programmers bloom”1
did not work for Mao Zedong.
Do we really want knowledge workers
not
experiencing commercial software?
Have you done basic statistics in R?
1
May be a slight misquotationSlide9
Why JMP and R--what a JMP Staffer Says“JMP is a wonderful complement to R. The integration with R is surfaced with several new JSL commands that allow you to connect to an install of R on your desktop, send data to and from R, and submit R routines available through the R packages. JMP dialogs can easily be built for parameter input to R as a front-end, and more significantly, JMP’s interactive and dynamic statistical platforms and graphics make for a perfect back-end to R functions. The dialog below is an application that connects to R to create data for a given distribution and perform simulations to test the coverage of bootstrap confidence intervals for a few common statistics.” --
Kelci
Miclause
, JMPSlide10
Why JMP and R? Best to interactively explore data (e.g., subsetting
, aggregation)
JMP’s descriptive analytics results for many procedures
Can present a better engineered user experience for studentsSlide11
Why JMP and R? (not so obvious)Exposes students to scripting
Give students practice with software integration
Enables project management assignments
It’s not an all (or ) world Slide12
Software Tools UsedJMP Pro 13 and JSL scripting language (also works in JMP 12 or 13)
R version 3.3.2 with various libraries
RStudio
2.3-2 (not much help this time)Slide13
Required SkillsJMP user that can perform basic analyses
Some awareness/experience with scripting languages in general
Able to search Internet
or
ask “Buddy” (but not Siri or Alexa!) questionsSlide14
Getting StartedInstall JMP and R (libraries optional, can be added on the fly)
Open JMP Script window
File
>
Open
(select script from dialog) or
File
>
New
>
Script
Execute
R
Init
();
(opens R and links JMP to R)Slide15
JSL R-integration BasicsR Init
();
(opens R and links JMP to R)
R Send();
(sends data to R)
R Get();
(retrieves data from R)
R Submit(“ ”);
(sends R commands to R)
R Term();
(terminates JMP and R link)Slide16
JSL R-integration: How it worksCommand line (log) output appears in JMP log window
Graphic outputs appear in separate window (as they would in R)Slide17
JSL General Commands Used Open();
opens a data source in JMP
New Window();
and
Button Box() together
allow creation of dialogs with command buttons (minimally implemented in examples)Slide18
JSL Utility Commands Used Open();
opens a data source in JMP
New Window();
and
Button Box() together
allow creation of dialogs with command buttons (minimally implemented in examples)Slide19
Disclaimers for Examples
Emphasizes concepts, not techniques
Not necessarily examples of how to best apply JMP or R
No specialized or obscure R methodsSlide20
Open in JMP and Use Data in R
R
Init
();
dtOrig
=
Open
();
New Window
( "Select Data",
Button Box
( "Send Selected Data To R",
JMPdt
=
Current Data Table()
;
R Send
(
JMPdt
,
Selected
( 1 ) );
R Submit
( "print(
JMPdt
)" );
)
);Slide21
Open in JMP and Use Data in R
ResultSlide22
Back and Forth From R
R
Init
();
R Submit
( "data(attitude)" );
R Get
( "attitude" ) <<
New Data View
;
New Window
( "Attitude Survey",
Button Box
( "Send Selected Data To R",
JMPdt
=
Current Data Table()
;
R Send
(
JMPdt
, Selected( 1 ) );
R Submit
( "print(
JMPdt
)" );
R Get
(
JMPdt
)<<
NewDataView
;
)
);Slide23
Back and Forth From R
ResultSlide24
“Better” Back and Forth From R
R
Init
();
R Submit
( "data(attitude)" );
R Get
( "attitude" ) << New Data View;
New Window
( "Attitude Survey",
Button Box
( "Send Selected Data To R",
JMPdt
=
Current Data Table()
;
R Send
(
JMPdt
, Selected( 1 ) );
R Submit
( "
newTable
<-
rbind
(
JMPdt
,
JMPdt
[]) " );
R Get
(
JMPdt
)<<
NewDataView
;
)
);Slide25
Better Back and Forth From R
ResultSlide26
Open in JMP and Use Data in R (recalled)
R
Init
();
dtOrig
=
Open
();
New Window
( "Select Data",
Button Box
( "Send Selected Data To R",
JMPdt
=
Current Data Table()
;
R Send
(
JMPdt
,
Selected
( 1 ) );
R Submit
( "print(
JMPdt
)" );
)
);Slide27
Use R for Hierarchical Cluster Analysis
R
Init
();
dtOrig
=
Open
(“F:/
ThrillRides.jmp
”);
New Window
( “Thrill Rides",
Button Box
( "Send Selected Data To R",
JMPdt
=
Current Data Table()
;
R Send
(
JMPdt
,
Selected
( 1 ) );
R Submit
( "
dd
<-
dist
(scale(
JMPdt
[, 3:9]), method = \!"
euclidean
\!" )
hc
<-
hclust
(
dd
, method = \!"centroid\!")
plot(
hc
, labels =
JMPdt
[, 2])
");
)
);Slide28Slide29
R plot(hc) and
JMP
Dendograms
(unfair comparison?)Slide30
JMP Fully Interactive DashboardSlide31
JMP Data Table SubsettingSlide32
Thank You!
David Stephan
Two Bridges Instructional Technology
david@TwoBridgesIT.com
SEDSI 2017 DASI Session, Thursday, February 23, 2016, 3 PM