/
FLIM - Detector FLIM - Detector

FLIM - Detector - PowerPoint Presentation

luanne-stotts
luanne-stotts . @luanne-stotts
Follow
378 views
Uploaded On 2017-03-13

FLIM - Detector - PPT Presentation

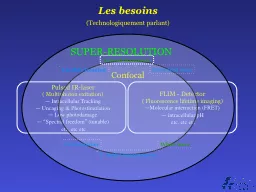
Fluorescence lifetime imaging Molecular interraction FRET intracellular pH etc etc etc Pulsed IRlaser Multiphoton exitation Intracellular Tracking Uncaging amp Photostimulation ID: 524039

resolution microscopy imaging fluorescence microscopy resolution fluorescence imaging localization super optical state emission depletion lateral axial photon 2013 laser

Share:

Link:

Embed:

Download Presentation from below link

Download Presentation The PPT/PDF document "FLIM - Detector" is the property of its rightful owner. Permission is granted to download and print the materials on this web site for personal, non-commercial use only, and to display it on your personal computer provided you do not modify the materials and that you retain all copyright notices contained in the materials. By downloading content from our website, you accept the terms of this agreement.


Presentation Transcript

Slide1

FLIM - Detector

( Fluorescence lifetime imaging)

—Molecular interraction (FRET)— intracellular pH etc. etc etc

Pulsed IR-laser

( Multiphoton exitation)

— Intracellular Tracking— Uncaging & Photostimulation — Low photodamage— “Spectral freedom” (tunable) etc. etc etc

Confocal

SUPER-RESOLUTION

Les besoins

(Technologiquement parlant)

Lambda Imaging

Motorized stage

White laser

CO2 chamber

Z- Drift Compensation

Second-HarmonicSlide2

FL1

F

FL2

FL1

FRET

1-10 nm

Time (ns)

Fluorescence-Lifetime Imaging (FLIM)

Free

CoupledSlide3

400 nm

Fluorescence

Jablonski

diagram

450 nmSlide4

400 nm

Fluorescence (true)

Jablonski

diagram

450 nmSlide5

Fluorescence-Lifetime Imaging (FLIM)

Lin HJ et al. Cytometry A. 2003

Fluorescence lifetime-resolved pH imaging of living cells.

Alpy F et al. J Cell Sci. 2013

STARD3 or STARD3NL and VAP form a novel molecular tether between late endosomes and the ER.

Molecular Interactions

Intracellular pHSlide6

Fluorescence-Lifetime Imaging (FLIM)

Drugs release

Basuki JS et al. Nano. 2013

Using fluorescence lifetime imaging microscopy to monitor theranostic nanoparticle uptake and intracellular doxorubicin release.

Intracellular Ca

++

Sagolla K et al. Anal Bioanal Chem. 2013

Time-resolved fluorescence microscopy for quantitative Ca2+ imaging in living cells.Slide7

Multiphoton exitation

800 nm

800 nm

1200 nm

1200 nm

1200 nm

400 nm

Dr. Maria Göppert-Mayer : theory of two-photon quantum transitions

(two-photon absorption and emission)

1931

,

Jablonski

diagram

450 nmSlide8

Prof.

Watt W. Webb et al.

Two-photon laser scanning

fluorescence microscopy

: 1990

Femtosecond pulsed laser &

Spatial photon concentrationSlide9

Luo at al. Cell Structure and Function 2006, 31: 63

Comparison of photoactivation of PA-GFP in vivo with single-photon (405 nm) and multiphoton (790 nm) laser light.

Photoconversion

Excitation areaSlide10

Conventional / Confocal / BiphotonSlide11

Anisotropic optical properties of molecules

Multiphoton polarization microscopy

polarizator

Biphotonic

Laser

Linear dichroismSlide12

Biphoton polarization microscopy

Cell expressing GAP43-CFP-Gαi2 and α2a-adrenergic receptor

G-proteins orientation

+ Norepinephrine

Base line

Lazar J et al. Nat Methods. 2013

Two-photon polarization microscopy reveals protein structure and functionSlide13

O

F

F

A

B

B

1

A

1

MagnifyingSlide14

)))))))))))))

)))))))))))))

))))))))

)))))))))))))

DiffractionSlide15

Airy disk

DiffractionSlide16

Resolution

?

?Slide17

Resolution

Abbe diffraction limit

Abbe Resolution

x,y

=

λ/2NANumerical Aperture NA = n•sin(θ)

n

- refractive index of the imaging medium ( air, oil

)θ - aperture angle (1,4 in the best case)

D = 0.2 µmSlide18

Near-field optical microscopySlide19

Near-field optical microscopy

special ($)1.78 refractive index coverslips

special ($ $) 1.78 refractive index oil

special ($ $ $) objective 100x 1.65NASlide20

Near-field optical microscopySlide21

Total internal reflection

Θ

1

Θ

2

The critical angle is the angle of incidence above which the total internal reflectance occurs

Evanescent wave

≈100 nmSlide22

Total Internal Reflection Fluorescence Microscopy (TIRF)

McKinney et al.Nature Methods 6, 131 - 133 (2009)

5 µm

1 µm

Up to 20 nm of lateral resolution and 2–5 nm of axial resolutionSlide23

Structured Illumination Microscopy

The Moire effect

+

=

-

=Slide24

Structured Illumination MicroscopySlide25

Structured Illumination Microscopy

Up to 100 nm of lateral resolution and 300 nm of axial resolutionSlide26

Switch to nonfluorescente state

550 nm

Triplet state

Non fluorescent

Fluorescence

Jablonski

diagram

600 nmSlide27

PA-GFP

Emission

Desactivation

Emission

Desactivation

Super-resolution

Optical Fluctuation Imaging (SOFI)Slide28

Super-resolution

Optical Fluctuation Imaging (SOFI)

Fast, background-free, 3D super-resolution optical fluctuation imaging (SOFI).Dertinger T, Colyer R, Iyer G, Weiss S, Enderlein J.Proc Natl Acad Sci U S A. 2009

The second-order correlation function

t

1

:

:

:

:

t

n

t

1

:

:

:

:

t

nSlide29

Super-resolution

Optical Fluctuation Imaging (SOFI)

Fast, background-free, 3D super-resolution optical fluctuation imaging (SOFI).

Dertinger T, Colyer R, Iyer G, Weiss S, Enderlein J.

Proc Natl Acad Sci U S A. 2009

Up to 50 nm of lateral resolution and ? nm of axial resolutionSlide30

Super-resolution

Bleaching Assisted Localization Microscopy(BALM)

t

1

:

:

:

:

t

n

t

1

:

:

:

:

t

n

Fast, Bleaching/blinking assisted localization microscopy for

superresolution imaging using standard fluorescent molecules.

Burnette DT, Sengupta P, Dai Y, Lippincott-Schwartz J, Kachar B.

Proc Natl Acad Sci U S A. 2011 Dec 27;108(52):21081-6Slide31

Up to 50 nm of lateral resolution and ? nm of axial resolution

Super-resolution

Bleaching Assisted Localization Microscopy(BALM)

Fast, Bleaching/blinking assisted localization microscopy for

superresolution imaging using standard fluorescent molecules.Burnette DT, Sengupta P, Dai Y, Lippincott-Schwartz J, Kachar B.Proc Natl Acad Sci U S A. 2011 Dec 27;108(52):21081-6Slide32

Fluorescence Localization MicroscopySlide33

PA-GFP

PA-GFP

Fluorescence Photoactivation Localization

Microscopy

PA-GFP

Emission

Localization

(calculation)

Total Photobleaching

Stochastic

ActivationSlide34

Fluorescence Photoactivation Localization

Microscopy (PALM)

Hess, S.T., T.P. Girirajan, and M.D. Mason. 2006. Ultra-high resolution imaging by fluorescence photoactivation localization microscopy. Biophys J. 91(11):Slide35

ZHUANG LAB/HARVARD UNIV.

Fluorescence Photoactivation Localization

Microscopy

Up to 30 nm of lateral resolution and 150 nm of axial resolutionSlide36

Switch to nonfluorescente state

550 nm

Triplet state

Non fluorescent

Fluorescence

Jablonski

diagram

600 nm

400 nm

Thiols

(R-SH)

Ground state depletion

Ground stateSlide37

FITC

FITC

Ground State Depletion Microscopy

direct Stochastic Optical Reconstruction Microscopy

FITC

Stochastic

Activation

Localization

(calculation)

Emission

Total Deactivation

(Ground State Depletion)Slide38

Ground State Depletion MicroscopySlide39

doughnut-shape

+

=

Stimulated emission depletion

488 nm

520 nmSlide40

Stimulated emission depletion

(STED)

Up to 50 nm of lateral resolution and 500 nm of axial resolutionSlide41

P

oint Spread Function

Z

Working distanceSlide42

Point Spread Function

PSF describes the imaging system response to a point input

Z

I

n

microscopy the point spread functions is asymmetric due to lens imperfectionsSlide43

Confocal PSF

WF

CFSlide44

Schermelleh L et al. J Cell Biol 2010;190:165-175

Super-Resolution Microscopy

50

100

gSTED 3X

___

_____

2013

___

50

___

BiplanSlide45

Biplan Localization Microscopy

+ 400 nm

- 400 nm

0

Cylindrical

lensSlide46

Biplan Localization Microscopy

Vutara, Inc..Slide47

+

=

X Y

X Y Z

Stimulated emission depletion 3XSlide48

Stimulated emission depletion

(STED 3X)

Up to 50 nm of lateral and axial resolutionSlide49

Schermelleh L et al. J Cell Biol 2010;190:165-175

Super-Resolution Microscopy

50

100

gSTED 3X

___

_____

2013

___

50

___

Biplan