/
Intercity Land Public Transport Challenges in Developing Country: A Ca Intercity Land Public Transport Challenges in Developing Country: A Ca

Intercity Land Public Transport Challenges in Developing Country: A Ca - PDF document

luanne-stotts
luanne-stotts . @luanne-stotts
Follow
388 views
Uploaded On 2016-04-29

Intercity Land Public Transport Challenges in Developing Country: A Ca - PPT Presentation

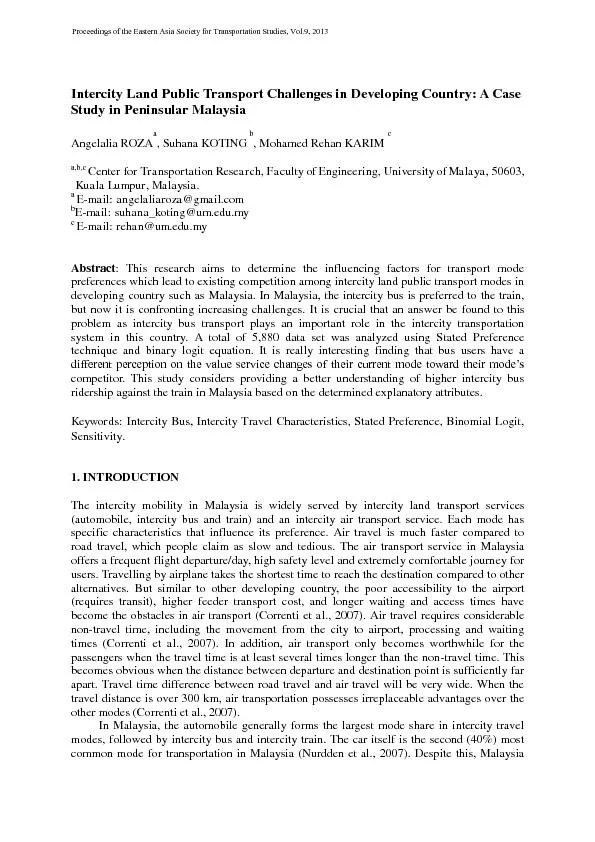
Angelalia ROZASuhana KOTINGMohamed Rehan KARIM abcCenter for Transportation Research Faculty of Engineering AbstractThis research aims to determine the influencing factors for transport mode pre ID: 298992

Angelalia ROZASuhana KOTINGMohamed Rehan KARIM

Share:

Link:

Embed:

Download Presentation from below link

Download Pdf The PPT/PDF document "Intercity Land Public Transport Challeng..." is the property of its rightful owner. Permission is granted to download and print the materials on this web site for personal, non-commercial use only, and to display it on your personal computer provided you do not modify the materials and that you retain all copyright notices contained in the materials. By downloading content from our website, you accept the terms of this agreement.


Presentation Transcript

Intercity Land Public Transport Challenges in Developing Country: A Case Study in Peninsular Malaysia Angelalia ROZASuhana KOTINGMohamed Rehan KARIM a,b,cCenter for Transportation Research, Faculty of Engineering, AbstractThis research aims to determine the influencing factors for transport mode preferen Keywords: Intercity Bus, Intercity Travel Characteristics, Stated Preference, Binomial Logit, Sensitivity. 1.INTRODUCTION The intercity mobility in Malaysia is widely served by intercity land transport services (automobile, intercity bus and train) and an intercity air transport service. Each mode has specific characteristics that influence its preference. Air travel is much faster compared to relies on buses and trains for intercity land public transport movement. Train is preferred because of good accessibility to the terminal, even though less comfort th an the bus. Sometimes the travel time becomes longer in certain routes, since the conventional train is still single track, lower speed and the rail network coverage is limited. Bus services are available in all cities in Peninsular Malaysia. The fare is a lso affordable for long journeys. It offers more comfort and shorter travel time than the train. But accessibility to the terminal is sometimes poor since the bus terminal is usually located around the border of the city. Intercity bus is still the preferr ed mode. The wider route coverage of intercity bus, higher departure frequency, lower fare, shorter travel time are among the factors to choose an intercity bus rather than train in Malaysia. These two types of land public transport modes constantly compet e against each other, so bus and rail will be considered in this further study of intercity land public transport. Table 1 shows a brief review of intercity land public transport mode characteristics in Malaysia. Table 1. Intercity land public transport m ode characteristics in Peninsular Malaysia Transport Mode The Characteristic of Transport Mode Intercity Bus  Intercity bus service is available in almost all of the cities in Peninsular Malaysia, unlike rail which has s limited track service, especially i n the east corridors of Peninsular Malaysia.  The wider route coverage is among the reasons why intercity bus has become more popular than intercity train. Intercity Train  In Malaysia, the shortage of resources for locomotives and crews, the low average t rain speeds (60 kph), narrow 1 meter track gauge and old rolling stock have become the constraints in rail transport (Abdul et al ., 2008). These constraints have resulted in longer travel times on certain routes. In addition, the restricted market coverage for the Keretapi Tanah Melayu Berhad (KTMB) network has also become a contributory obstacle in railway transport in comparison to the road network ( Kumar, 2008 ) . Therefore the bus is getting a high modal share since it is quick and comfortable. Train in Malaysia is preferred because of its good accessibility t o the train station. Train also has advantages over the road transport industries in terms of the socio - economic benefits such as the number of road accidents and pollution (Abdul et al ., 2008).  In terms of service, Malaysia’s intercity train KTMB offers a more comfortable berth than the bus seat, but requires a higher price. However, at the same class level of service, the train is the less comfortable (seat) than the bus. 2. CURRENT SITUATION OF INTERCITY LAND MODE TRANSPORT SERVICE IN MALAYSIA Nation al Spatial Framework 2020 explains that future urban growth centers will be concentrated in strategic conurbations (JPBD, 2010). The concentration of development in conurbations means that urban - based economic activities will be concentrated in the main co nurbations of Kuantan, Penang/ George Town, Johor Bahru (JB) and Kuala Lumpur (KL) to promote efficiency in land use and infrastructure planning which is globally competitive. The concentration of development and the attraction of KL and its conurbations m ay influence the intercity movement in these origin and destination pairs. In relation with the concentration of development in the N ational Spatial Framework 2020 , intercity travel to the north, south and east of Peninsular Malaysia were categorized into eight main corridors. The eight main intercity corridors are namely; KL - Alor Setar, KL - Penang, KL - Ipoh, KL - JB, KL - Melaka, KL - Kuantan, KL - Kota Bharu and KL - Kuala Terengganu (Figure 1 ). Figure 1. Basic road network and Main intercity tr ansport corridor based on the development in economic region in Peninsular Malaysia (JPBD, 2005) 2.1. Road Transportation Network in Malaysia Roads in Malaysia are generally categorized into Federal roads, State roads, Municipality roads and toll roads ( privatized roads). These categories are based on ownership and administration of the road concerned. The total road length in 2010 is 157,000 km of which 12% are Federal Roads and 75% are State roads and Municipality roads. Toll roads are mainly interurban expressways and urban expressways and this amount to around 1,820 km. The basic road network in Peninsular Malaysia is illustrated in Figure 1. JPBD (2005) note d that the ninth Malaysia Plan (9MP) for the period 2006 - 2010 marked the expansion of infrastru cture development with an effort to increase the efficiency of existing facilities and improve the accessibility and linkages in rural areas. All major economic centers are linked to one another and have good connection to the ports with relatively good ro ad networks (Abdul et al ., 2008). Malaysia road transportation accounts for 96% of total passenger and goods transport in the country. Intercity movement via the road network along the corridors of KL - Ipoh, KL - Alor Setar, KL - Penang, KL - JB and KL - Melaka a re accommodated by the existing North - South Expressway (NSE). According to Projek Lebuhraya Utara - Selatan Berhad [PLUS] (2011a ), the NSE is the longest expressway in Malaysia , wi th the total length of 772 kilometers spanning from Kedah (near the Malaysi an - Thai border ) to JB (at the southern tip of Peninsular Malaysia ). Bes ides the NSE, intercity movement along the five corridors mentioned is also accommodated by others 3 expressways which adjoin each other, with a total of 847.7 km of inter - urban toll highways, used to support traffic movement in Malaysia. In addition, the Butterworth - Kulim Expressway (BKE) supports a connection of the east ( Kedah and Kulim ) with the west ( Penang and Butterworth). BKE is also a main route to Federal route ( Ea st - West Highway ) toward Perak , Grik , Ked ah and Baling ( PLUS, 2011b). IPOH TERENGGANU PENANG ALOR S E TAR KL KOTA BHARU MELAKA JOHOR BAHRU KUANTAN 1 8 3 2 4 5 6 7 KL This expressway supports the intercity movement along KL - Kuantan, KL - Terengganu and KL - Kota Bharu corridors. 2.2. Rail Transportation Network in Malaysia Kumar (2008) highlights that the Malaysian Government made one of the most vital shifts in its urban transport policy by introducing rail systems in the capital city of Kuala Lumpur (KL) in the 1990’s. KTMB is a private - sector company that opera tes the railway network in Malaysia. It was corporatized in August 1992 (KTMB, 2012). Intercity movement via the railway network has been accommodated through three major routes (Figure 2).The first route from KL to the North (ending at Padang Besar), supp orts rail transport demand along the KL - Alor Setar, KL - Penang and KL - Ipoh corridors, the second route from KL to the South (ending at JB), supports the demand along the KL - Melaka and KL - JB corridors, while the third line from KL to the East with the final destination at Tumpat supports the demand along the KL - Kota Bharu corridor. Unfortunately, certain corridors such as KL - Melaka, KL - Kuala Terengganu and KL - Kuantan are not yet well - connected towards these three major routes. Figure 2. Intercity train rou te in Peninsular Malaysia ( KTMB, 2012) After a long period of limited investment in KTMB, the intercity railway infrastructure is now being expanded and modernized (Abdul et al ., 2008; Kumar, 2008). Intercity train service under KTMB management has improv ed its performance in many aspects, such as offering better service and faster travel time. KTMB continues with its program of refurbishing the third class coaches that ply the east coast corridor (Abdul et al ., 2008). At present, the country has about 2, 200km of railway tracks, with plans for more to come. KTMB operates train services such as intercity travel, suburban commuter services, freight services, container’s haulage and property storage (KTMB, 2012).Currently the KTMB intercity runs 24 intercity passenger trains daily, consisting of 16 express trains and 8 local trains (Abdul et al ., 2008). In 2010, KTMB introduced the Electric Train Service (ETS), a rapid intercity service between KL and Ipoh, ultimately running 32 services a day. Based on these facts, rail transport wo uld play a crucial role in the development of public transport facilities in Malaysia (Kumar, 2008). 3. METHODOLOGY The data used in this research is a combination of primary and secondary data. In this preliminary study, t he sec ondary data was obtained from government agencies such as the Ministry of Transport (MOT), Suruhanjaya Pengangkutan Awam Darat (SPAD), Keretapi Tanah Melayu Berhad (KTMB), and Malaysia Airport Holdings Berhad (MAHB) and used in the modal competition analys is. Meanwhile, the primary data was collected through a field survey since secondary data was not available. A preliminary survey for eight origin - destination pairs in Malaysia have been conducted in order to analyze the modal competition with regards the trunk mode service and access and egress mode services to the terminal. A paper based survey has been developed in order to gather information of intercity public transport user’s characteristics. For the case study area (KL – Penang and KL – JB), the fie ld survey conducted in this study uses a combination of 5 minute on - site interviews and 15 minute on - site questionnaire sessions in terminals. A number of 120 intercity bus users were the respondents of this questionnaire - based study for both corridors. A total of 5,880 data set of stated preference data set have been analyzed for both corridors. The questions are designed in the form of Reveal Preference (RP) questions and Stated Preference (SP) questions. T he SP questions were designed in the form of two scenarios: intercity bus scenario and intercity train scenario . The intercity bus scenario represents the changes to intercity bus service values when the intercity train values remain constant. The intercity train scenario represents the changes to interc ity train service values when the intercity bus values remain constant. The intercity mode preference in both scenarios was evaluated by using the four attributes: travel time, fare, frequency and access time. Binary Logit equation and Regression analysis had been employed in SP data analysis. Remains that U Bus = intercity bus utility as effect of its service value changes, U Train = intercity train utility as effect of its service value changes . Thus, P Bus = Probability of choosing intercity bus can be w ritten as equation (3.1): P Bus = ………………………………………… .. ………. . . (3.1) The dependent variable in the regression model was the intercity mode utility as the effect of the intercity mode service value changes. The independent variables in this mode l were the mode service value differences. The mode service value which was evaluated consists of travel time, fare, frequency and access time. Therefore, equation (3.2) above c an be explained as equation (3.2 ): Y = U Bus – U Train = b 0 + b 1 ( X 1 Bus – X 1 Train ) + b 2 ( X 2 Bus – X 2 Train ) + b 3 ( X 3 Bus – X 3 Train ) + b 4 ( X 4 Bus – X 4 Train ) ................................ ....................... (3. 2 ) Whereas; A, b 0 = intercept , B, b 1 , b 2 , b 3 , b 4 = model parameter , X 1 = intercity mode travel time difference, and X 1 = X 1 Bus – X 1 Train , X 2 = intercity mode fare difference, and X 2 = X 2 Bus – X 2 Train , X 3 = intercity mode frequency difference, and X 3 = X 3 Bus – X 3 Train , X 4 = feeder mode access time difference to intercity land public transport mode terminal, and X 4 = X 4 Bus – X 4 Train . This model was uses adjuste d R 2 to cross - validate the model. To check the statistical significance for statistical model validations, T - test and F - test are used. Those tests are performed at a 5% significance level (α). 4. RESULT AND DISCUSSION 4.1. Preliminary S tudy In the dev eloping world, intercity travel is dominated by bus and conventional rail travel (Ribeiro et al ., 2007). Similarly, intercity travel i n Malaysia is also dominated by these intercity land modes. The intercity land modes challenges will be an interesting iss ue to discuss and are related to fare, travel time, departure frequency and feeder mode access time competition. A field survey has been conducted in order to collect some information on selected Origin - D estination pairs for further modal competition anal ysis. The distance is categorized into three categories; the first is short distance (less than 300 km), the second is medium distance (301 - 400 km), and the third is long distance (more than 401 km). Intercity bus demand is relatively higher compared to o ther modes for the same distance traveled (Table 2 ). Intercity bus is more flexible regarding its departure frequency compared to the train. A great number of intercity buses depart from KL to the selected corridors everyday (Table 2 ). 4.1.1. General desc ription on intercity transport mode share The intercity transport modes under investigation included bus , rail , air , and automobile. According to travel distance (Table 2 ), this study found that the mode share pattern in Malaysia was varied. (I) Short dista nce category Table 2 shows that the automobile is very dominant in the short distance category. In the corridor with less mode competitors, the automobile also gains a higher mode share, for example in KL - Melaka (automobile 86.2%, intercity bus 13.8%), in KL - Kuantan (automobile 71.8%, intercity bus 16.0% and air 12.1%), and in KL - Ipoh (automobile 60.5%, intercity rail 18.4% and intercity bus 21.1%). A high dependency on the automobile in the short distance corridor makes the air transport mode less favora ble compared to other modes. Air transport failed to compete with the automobile (i.e., KL - Melaka corridor) or rail and bus (i.e KL - Ipoh). Except for KL - Kuantan, air transport is still getting a high mode share (12.1%) after the bus (16.0%), since no rail infrastructure is provided in this corridor. An interesting condition appears on the KL - Ipoh corridor. There’s slightly less dependency on the automobile (60.5%) for this corridor compared to KL - Kuantan (71.8%) or KL - Melaka (86.2%). (II) Long distance category In contrast to the short distance category, public transport has a dominant mode share for the long distance category (as in the KL - Kota Bharu, KL - Alor Setar or KL - Terengganu corridors). Passenger willingness to take public transport (bus, train or air tr ansport mode) for the longer distances usually tends to increase. This is in line with Correnti et al . (2007), who state that as the travel distance increases private cars lose their competitive advantage. When the long distance corridor is provided by an air transport service, the air transport mode becomes dominant, i.e., KL - Kota Bharu 52.3%, KL - Alor Setar 33.7% and KL - Terengganu 61.3%. (III) Medium distance category In the medium distance category, intercity public transport modes compete with the automobi le (i.e. KL - Penang and KL – Johor Bahru). The air transport mode gets a higher mode share percentage than the automobile for intercity ridership in the KL – Penang corridor, however air transport is often out of reach due to its relatively high service cost. T herefore, the intercity land public transport mode is an alternative. Within the intercity land public transport, rail and bus are barely compete d with one another. Table 2. Demand, frequency and mode share competition in selected corridors O - D Pairs (Fro m Kuala Lumpur) R oad Dis - tance Intercity Mode Demand by Mode (Passenger/day) Intercity Mode Frequency (Departure/day) Intercity Mode Share in Selected main corridor (%) Bus a), e) Rail b) Air c) A uto Mo - bile d) Bus a), e) Rail b) Air c) A uto Mo - bile d), e) Bu s a), e) R ai l b) Air c) A uto Mo - bile d), e) Penang 369 1,218 791 3,514 4,550 42 4 32 3,500 12.1 7.9 34.9 45.2 Ipoh 205 1,815 1,578 - 5,200 55 - - 4,000 21.1 18.4 0.0 60.5 Kota Bharu 474 1,144 656 2,086 104 52 3 3 80 28.7 16.4 52.3 2.6 Kuala T ereng - ganu 455 546 - 988 78 26 - 9 60 33.9 0.0 61.3 4.8 Kuantan 259 726 - 549 3,250 33 - 5 2,500 16.0 0.0 12.1 71.8 Johor Bahru 368 3,082 777 1,098 5,850 128 3 10 4,500 28.5 7.2 10.2 54.1 Melaka 144 1,148 - - 7,150 41 - - 5,500 13.8 0.0 0.0 86.2 Alor Setar 462 552 439 769 520 24 4 7 400 24.2 19.3 33.7 22.8 Source: a) SPAD (2011), b) KTMB (2011), c) MAHB (2011), d) JKR (2008), and e) Primary Data Analysis (2011) 4.1.2. Factor influencing intercity land public transport mode preference in selected corr idors As seen in Table 3, fare and travel time attributes make the intercity bus the most popular transport mode option. Intercity land public transport traveling costs are much cheaper than either flight fare or automobile fuel consumption costs within e ach corridor . From observation of the selected corridor, intercity bus travel time is shorter than intercity train (Table 3). 4.2. Study Case Area In relation with the concentration of development in the National Spatial Framework 2020, intercity trave l to the north, south and east of Peninsular Malaysia were categorized into eight main corridors. Referring to Jabatan Perancangan Bandar dan Desa Semenanjung Malaysia (2005), the population of Malaysia is likely to increase in several national conurbation s such as Pulau Pinang and Johor Bahru (Department of Statistics, 201 1 ). High density of population, concentration of development and the attraction of KL and its conurbations may influence the intercity movement in these origin and destination pairs. In this study, the selected corridors for intercity land transportation competition in Malaysia are possibly the north or the south corridors. The east corridors need to be excluded, since the east corridors are not well - connected with the KTMB railways majo r routes. Since all of the intercity modes services only exist in the medium distance corridors, the medium distance is selected as the study area. Thus, the further intercity travelling characteristic from KL to the north corridor (medium distance) is rep resented by KL - Penang corridor and from KL to the south corridor (medium distance) is represented by KL - J ohor B ahru corridor. Table 3. Fare and travel time competition in selected corridors O - D Pairs (From Kuala Lumpur) Average Intercity Mode Fare (RM) Average Intercity Mode Travel Time (Hour) Bus Rail Air Auto - mobile Bus Rail Air Auto - mobile Penang 41.30 46.40 156.00 157.00 4.50 - 5.50 6.50 - 7.50 0.80 3.50 - 4.00 Ipoh 21.30 27.60 - 92.00 2.50 2.00 - 3.00 - 2.00 Kota Bharu 34.00 55.00 137.00 147.00 8.00 - 8.50 12.00 1.00 4.50 - 5.00 Kuala Terengganu 43.00 - 125.00 165.50 8.00 - 0.90 4.50 Kuantan 19.60 - 198.00 107.00 3.50 - 0.70 2.50 Johor Bahru 40.30 54.50 125.50 156.00 4.50 - 5.50 6.50 - 7.50 0.90 3.50 - 4.00 Melaka 12.60 - - 64.00 3.00 - - 1.50 Alor Setar 40.60 50.60 130.00 194.60 5.00 - 7.00 10.00 1.10 4.00 Remarks: 1) Automobile refers to Car 2011, Fuel efficiency 12 km/liter, Fuel price 0.637 USD/liter (Model Car: Proton Saga 1600 cc, Automatic Transmission) 2) Toll fare and fuel consumption are included in automobile fare calculation for single passenger. 3) Exchange Rate in 2011: 1 USD = RM 3.05 4) Bus mode fare refers to average fare for 1st, 2nd and 3rd class 5) Rail mode fare refers to average fare for 1st, 2nd and 3rd class of conventional rail. For Ipoh, ETS was included. 4.2.1. The competition of intercity transport travel time, travel cost and accessibility in KL - Penang and KL - Johor Bahru (JB) corridors Comprehensive information regarding intercity trunks and feeder mode service has been derived for the mode competition analysis in the KL – Penang an d KL - JB corridor. Travel time, fare and feeder mode access time were consistently detected as the reasons to prefer an intercity bus in this case study area. In Figure 3, it can be seen that intercity bus f are is cheaper than the train fare for both corridors of KL - Penang and KL - JB. The total travel time when travelling by bus is much shorter compare to travelling by train for both corridors of KL - Penang and KL - JB. Total travel time of travelling by bus alo ng KL - JB is 5.83 hours and KL - Penang is 6.22 hours. While total travel time of t ravelling by train along KL - JB is 8.64 hours and KL - Penang is 8.83 hours . Based on Figure 3, the total travel time by bus is shorter than the train. Intercity travel using lan d public transport would be very much affected by the degree of accessibility to the transport terminals, be it the intercity bus terminal or train terminals. Wee et al . (2001) mention about the importance of accessibility. Accessibility indicator implies the greater or lesser the ease of access to activity center ( Gutiérrez & Urbano, 1996 ) . Accessibility may also influence travel demand as the transport component and the time needed to carry out activities as the temporal component ( Geurs & Wee, 2004 ) . Appropriate and adequate infrastructure has to be made available for direct an d easy access to these terminals, in order for the final door to door travel time between origin and destination can be minimized. Figure 3 . The competition of intercity transport travel cost and travel time Figure 3 describes that the intercity train mode has a plus point in accessibility. As the parameters, all the feeder access & egress time (to/from intercity train station) are calculated as the shortest one. In specific, access time to bus terminal for both corridors ( feeder mode waiting time +in feeder access mode time) is longer (0.29 hours) than access time to train station (0.25 hours). For KL - JB corridor, the feeder mode egress time spent from bus terminal ( feeder mode egress waiting time +in feeder egress mode time) to final destination is 0. 54 hours while access time spent from train station to final destination is only 0.39 hours. Similarly, for KL - Penang corridor, the feeder mode egress time spent from bus terminal to final destination is 0.26 hours, while access time spent from train stati on to final destination is only 0.08 hours. Figure 4 . The c omponent of time of a total travel time Refers to the fractional time bar in Figure 4, it is proven that the accessibility from/to terminal for intercity train is better than the bus. Accordin g to Figure 4 the fraction value of in vehicle time for intercity bus is lower than for intercity train. In details, in vehicle time (intercity train) from KL to Penang is 96.3% of its total travel time, while from KL to JB it is 92.6%. Intercity bus in ve hicle time value is 91.2% for KL - Penang and 85.8% for KL - JB. Fare Competition (USD/ one way) In vehicle time Competition (hours) Access time (hours) Egress time (hours) Total travel time (hours) KL - Johor Bharu Automobil e Air Rail 3.3 5.83 8.64 2.63 0.54 0.54 0.39 0.29 0.25 1.17 8.0 0.92 3.3 5.0 18.57 13.10 44.94 50.94 Intercity Mode Fare (USD/ one way) In vehicle time (hours) Access time (hours) Egress time (hours) Total travel time (hours) KL - Penang Automobile Air Rail Bus 5.5 8.83 3.08 6.22 1.17 0.25 0.29 15.52 30.48 51.23 5.67 8.5 0.83 5.5 13.05 0.26 0.08 1.08 4.7% 2.8% 38.0% 91.2% 96.3% 26.9% 100.0% 4.2% 0.9% 35.1% KL - Penang Access time (hours) In vehicle time (hours) Egress time (hours) 5.0% 2.9% 44.5% 85.8% 92.6% 35.0% 100.0% 9.3% 4.5% 20.5% Bus Rail Air Automobile KL - Johor Bharu Access time (hours) In vehicle time (hours) Egress time (hours) Lack of public facilities and route coverage limitation has force intercity passenger to transfer several times to access an intercity bus terminal. Bus terminals should be constructed with fores ight, from good accessibility to well thought out and planned location ( thestar.com.my ) . It should be assigned to a single agency to manage the system. Improvements are currently being made to enhance public transport accessibility. New integrated terminals for land public transport are being developed as transport hubs to facilitate commuting to the North, South and East of Peninsular Malaysia. All three integrated transport hubs will ultimately replace exist ing interstate terminals across Kuala Lumpur. The integrated terminal in Bandar Tasik Selatan (BTS) caters for southbound movements (has just been completed and is in operation in March 2011), while the Sungai Buloh terminal is for northbound and the Gomba k terminal is for eastbound buses (expected to be completed in 2011 and operated by 2012). The accessibility for feeder transport would be a big challenge for intercity bus in the future intercity land transport competition . 4.2.2. Socioeco nomic , demograp hic and travel behaviour characteristic analysis In exploring intercity bus preference based on respondents behaviour characteristics, some of variables are considered; such as: alternative mode f or intercity travelling, travel er perception on the distanc e to terminal, reason for taking bus intercity mode travel time, intercity mode fare, respondents age, marital status, gender, occupation, monthly income, for feeder mode, travel time for intercity bus feeder mode (access), total travel time of feeder mode (access), intercity bus feeder mode fare (access), travel time in intercity bus feeder mode (egress), total travel time of feeder mode (egress), intercity bus feeder mode fare (egress) and waiting time in the terminal/station. A field survey was conducte d in three months at several intercity bus terminals and train stations in Kuala Lumpur, Johor Bahru and and Penang. Intercity bus terminals observation included: bus terminal of Bukit Jalil, Puduraya bus terminal, bus terminal of Shah Alam in Kuala Lumpur , Larkin bus terminal in Johor Bharu and Butterworth in Penang. In addition, a field survey has been conducted at intercity train stations, in Kuala Lumpur, Johor Bharu and Penang. The results from the field survey reported that t he majority age of the re spondent is below 25 years old (53.6 and 56.7%) and single (76.7% and 70.0%). In some interview sections involving female respondents (73.3% and 46.7%), they said that they preferred to use the intercity bus because of shorter bus travel time. They do not feel comfortable being in train for a long time. In this paper, intercity travel was divided into 4 purposes: working & business purpose, educational purposes, recreational/social purposes and other purposes. Working & business purpose and others purpose in this paper are categorized into work travel, while recreational/social purposes and educational and other purposes are categorized into non - work travel. Regarding the survey result, mostly respondents are dominated by non - work travelling purpose. Figure 6 shows that for both corridors (KL – Penang and KL – JB), majority of respondent is student (66.7% and 66.7%). As can be seen from Figure 5, the intercity travelling is commonly done every month (26.7% and 30%). Respondents’ major trip purposes are soci al visit & recreation (53.3% and 50.0%) followed by for educational purpose (28.3% and 41.7%). Figure 7 proves that the fare is the main reason in choosing intercity mode (43% and 30%). The second important factor is comfort (16.7% and 20%), following by t ravel time (8.3% and 25%) and feeder transport accessibility (13.3% and 8.3%). Comfort can be attached as an effect of travel time. In some of interview sections, respondents said not feeling comfortable in the intercity train with its long travel time. Sa fety seems becoming the reason only by 10% of respondents (KL - JB) and 13.3% of respondents (KL - Penang). Figure 5 . Respondent age, gender, mar it al status Figure 6 . Respondent occupation and trip purpose Respondents travelling perceptions of particul ar intercity modes and traveller attitudes may affect their preference and choices ( Correia & Antunes, 2012 ; Yang, et al . , 2009 ) . The distance to terminal also affects the intercity traveler perception in choosing an intercity transport mode. A longer distance usually related to a longer access time for feeder mode service. Only 13.3% (KL - JB) and 10% (KL - Penang) of the res pondent mentioned that the distance to terminal is not important for them to decide what intercity mode to use (Figure 7). 63% 37% 27% 73% 22% 77% 2% 3% 13% 27% 15% 22% 17% 3% 0% 10% 20% 30% 40% 50% 60% 70% 80% 90% Below 25 Years old Above 25 Years old Male Female Married Single Divorced Every day Every week Every month Every semester Once a year Rare Un certain Respo ndent s Age Gend er Marital Status Intercity Traveling Frequency KL - Penang KL - JB 17% 10% 2% 3% 67% 2% 12% 28% 53% 7% 0% 10% 20% 30% 40% 50% 60% 70% 80% Proffesional Staff Technical staff / skilled worker Managerial position Un Empoyed Student Pension Working & business purpose Educational Social visit & recreation Others purpose Occupation Trip purpose KL - Penang KL - JB Figure 7. Traveler perception on the distance to terminal, reason for taking bus, mode alternatives for intercity travelling I n de ciding to use public transport, respondents usually consider the feeder (access/egress) mode service, the feeder (access/egress) mode time, mode waiting time, the number of transfer, transit fare, and transit pass ownership, and the schedule flexibility ( Yang, et al ., 2009 ) . If there were no available public transport services, private car will be an alternative. Although so, driving own car for intercity travelling was not so much of a preference for a long trip, since they should consider fee, toll, transit pass ownership, schedule flexibility and the number of people who shared the trip with them ( Correia & Antunes, 2012 ; Yang, et al ., 2009 ) . Hu and Jen (2007) argue that if in - vehicle - travel - time is considered, customers may choose other intercity bus companies or alternative modes o f transport with similar or better service quality but with a lower service sacrifice. This survey found the train as the main competitor of intercity bus (KL - Penang 55% & KL - JB 40%). Some other respondents prefer to use private car as an alternative of b us (KL - Penang 27% & KL - JB 30%). Table 4. Feeder transport from/to intercity bus station Feeder transport to/from intercity bus terminal Access Egress KL - JB KL - Penang KL - JB KL - Penang private car 43.3% 36.7% 41.7% 36.7% motorcycle 3.3% 6.7% 5. 0% 6.7% Commuter bus 20.0% 16.7% 6.7% 16.7% LRT/ Commuter Train 25.0% 15.0% 10.0% 15.0% taxi 5.0% 21.7% 35.0% 21.7% others 3.3% 3.3% 1.7% 3.3% Table 4 (feeder transport from/to intercity bus station) shows that private vehicle as the feeder transport mode is accounted for 46.3% for KL - JB and 43.4% for KL - Penang. However, there is 20% (KL - JB) and 16.7% (KL - Penang) of the respondent still keen on using commuter 10% 17% 8% 43% 5% 13% 3% 40% 18% 30% 10% 2% 13% 15% 17% 55% 0% 10% 20% 30% 40% 50% 60% safety comfort travel time fare the availability of intercity mode feeder transport accessibility other personal reason Train Plane Private Car Motorcycle No alternative not so important Quite important important very important The reason for taking intercity bus Alternative mode for intercity traveling The distance to terminal effect perception KL - Penang KL - JB bus as an access mode. Others (25% and 15%) prefer LRT/ Commuter train. Similarly, for egress mode, private vehicle is still being the main feeder mode in both KL - JB and KL - Penang corridors (41.7% & 36.7%). Commuter bus and taxi are public feeder transport in Larkin intercity terminal (in JB). But in these two corridors, the commuter bus (6.7% a nd 16.7%) is not as popular as taxi (35% and 21.7%). Crisalli (1999) argued that, feeder transport service to the intercity terminal also affects the intercity traveller on choosing their intercity transport mode choice ( Crisalli, 1999 ) . This f ield survey interview found the similar result. Amounts of 13.3% (KL - JB) and 8.3% (KL - Pe nang) respondents argued to state that feeder service is important for them in deciding what intercity mode to prefer; whether bus or train. A better access to its station is an advantage offered by train. For example in KL, train station is located inside the KL central building in Kuala Lumpur city, while in JB train station is inside the JB central building. S ome intercity passengers avoid taking certain mode because of its poor access to the terminal, i.e. Duta bus terminal. There are only two option s for feeder public transport mode to access Duta terminal ; commuter bus or taxi. Duta terminal is quite far from downtown KL. Public transport feeder fare to Duta bus terminal is almost 2 times higher than to intercity train station in city center . Commuter bus as a feeder access mode in Kuala Lumpur normally has a normally long waiting time interval (around 30 minutes). To access Duta terminal, there are only 2 direct commuter bus from city center per day. So the commuter bus waiting time to access Duta ter minal is even longer than normal. If the passenger concern about waiting time, the taxi is an option. Taking the taxi from the city center means there will be around RM20 extra costs. The taxi fare can be as expensive as the intercity bus fares itself. BTS is a part of an integrated transport network in Malaysia to resolve the connectivity issues ( http://transitmy.org ) . It provides a better public facility and enhancement such as decrease the feeder transport service waiting time. Figure 8 shows the comparison of respondent monthly income, budget for transportation and budget for intercity travelling. Most of respondent’s monthly income in this study is bet ween $ 322.6 and $ 977.8, which most of them spent $ 16.3 - $32.6 for transportation and less than $ 16.3 for intercity budget. As Hensher (2007) emphasize that as individuals age and increase their income, individuals see existing service quality as incre asingly satisfying their requirements for service quality ( Hensher, 2007 ) . Figure 8 . Monthly income, transportation budget and inte rcity travelling budget 0 . 0 % 10 . 0 % 20 . 0 % 30 . 0 % 40 . 0 % 50 . 0 % 60 . 0 % Monthly Income (USD) Budget for transportation (USD) Budget for intercity travelling (USD) Uncertain; 8 . 3 % $ 16 . 3 ; 55 . 0 % $ 16 . 3 - $ 32 . 6 ; 20 . 8 % $ 32 . 6 - $ 65 . 2 ; 8 . 3 % � $ 65 . 2 ; 7 . 5 % $ 16 . 3 ; 9 . 2 % $ 65 . 2 - $ 97 . 8 ; 9 . 2 % � $ 97 . 8 ; 3 . 3 % $ 322 . 6 ; 39 . 2 % $ 322 . 6 - $ 977 . 8 ; 51 . 7 % $ 977 . 8 ; 9 . 2 % $ 16 . 3 - $ 32 . 6 ; 59 . 2 % $ 32 . 6 - $ 65 . 2 ; 19 . 2 % 4.2.3. Stated preference data analysis (I) Scenarios on intercity bus service Regression model involving scenarios on intercity bus service for KL – JB was shown in Table 5 and for KL – Penang corridor was shown in Table 6 . As shown in KL - JB corridor (Table 5 ), when the scenario on bus service changes applied, travel time difference (t(196) = - 18.22, p .05), fare difference (t(196) = - 26.69, p .05), access time differenc e (t(196) = - 14.68, p .05), waiting t ime (t(196) = 5.11, p .05 ), were found significantly influence the bus preference. While access mode’s fare were found not significantly influenced the bus preference. As shown in KL - Penang corridor (Table 6 ), when the scenario on bus service changes applied, travel time differen ce (t(196) = - 18.06, p .05), fare difference (t(196) = - 26.46, p .05), access time difference (t(196) = - 14.55, p .05) were found significantly infl uence the bus preference. But the waiting time and access mode’s fare were found not significant ly in fluence d the bus preference. Table 5 . Regression model involving scenarios on i ntercity bus service for KL – JB c orridor KL – JB c orridor S cenarios on intercity bus service Unstandardized c oefficients Standardized c oefficients t Sig. B Std. Error Beta (Constant) - 1.449 .095 - 15.228 .000 Travel time Difference - .015 .001 - .405 - 18.217 .000 Fare Difference - .069 .003 - .591 - 26.693 .000 Access time Difference - .023 .002 - .323 - 14.675 .000 Waiting Time .212 .041 .105 5.117 .000 Access Mode’s fa re .008 .006 .028 1.346 .178 Model JB Bus R= .608, Adj. R Square= .367, R Square Change= .369, and F(5, 1494) = 174.865 Table 6 . Regression model involving scenarios on interci ty bus service for KL – Penang c orridor KL – Penang c orridor S cenarios on i ntercity bus service Unstandardized c oefficients Standardized c oefficients t Sig. B Std. Error Beta (Constant) - 1.043 .087 - 12.055 .000 Travel time Difference - .012 .001 - .405 - 18.058 .000 Fare Difference - .066 .003 - .591 - 26.460 .000 Access time to intercity terminal Difference - .023 .002 - .323 - 14.547 .000 Waiting Time .001 .003 .007 .323 .746 Access Mode’s fare .005 .004 .023 1.111 .267 Model Penang Bus R= .598, Adj. R Square= .358, R Square Change = .358 and F (5, 1494) = 166.639. B ased on stated preference data in the model result, the coefficients for ‘travel time difference’, ‘fare difference’, and ‘access time difference’ scenario are negative. It means the increasing of these values will decrease the intercity bus preference. An interesting result is that intercity bus feeder mode fare (access) and waiting time in the terminal/station is found not significantly decrease the probability for bus pre ference. Moreover, the coefficients for waiting time and access mode fare are positi ve. It means the increasing of these values will increase the intercity bus preference. It is rationally unacceptable. Based on this condition , it the feeder access mode fare and waiting time should be excluded from the model. Thus the waiting time and acc ess mode fare would be no longer considers to influence the bus preference. (II) Scenarios on intercity train service Regression model involving scenarios on intercity bus service for KL – JB was shown in Table 7 and for KL – Penang corridor was shown in Table 8 . As can be seen from Table 7, all the intercity train service variables involved; travel time (t(196) = - 12.22, p .05), fare difference (t(196) = - 12.78, p .05), access time difference (t(196) = - 10.20, p .05), waiting time (t(196) = 5.73, p .05) , access mode’s fare (t(196) = - 2.69, p .05) were found significantly to influence intercity bus preference. Table 7 . Regression model involving scenarios on int ercity train service for KL – JB c orridor KL – JB c orridor S cenarios on intercity train servi ce Unstandardized c oefficients Standardized c oefficients t Sig. B Std. Error Beta (Constant) - .735 .095 - 7.772 .000 Travel time Difference - .009 .001 - 0.43 - 12.216 .000 Fare Difference - .029 .002 - 0.43 - 12.779 .000 Access time to intercity st ation Difference - .018 .002 - 0.36 - 10.202 .000 W aiting t ime .274 .048 - 0.11 5.733 .000 Access m ode’s fare - .019 .007 ` - 0.13 - 2.693 .007 Model JB Train R= .414, Adj. R Square= .172, R Square Change= .971 and F (5, 1434) = 59.407. As can be seen from T able 8, intercity train service variables involved; travel time (t(196) = - 12.07, p .05), fare difference (t(196) = - 12.63, p .05), access time difference (t(196) = - 10.08, p .05), were found significantly to influence intercity bus preference. The coefficients for these significance variables: ‘travel time difference’, ‘fare difference’, ‘access time difference’ and ‘access mode fare’ are negative. It means the increasing of these values will decrease the intercity bus preference. Table 8 . Regressi on model involving scenarios on intercit y train service for KL – Penang c orridor KL – Penang c orridor S cenarios on intercity train service Unstandardized c oefficients Standardized c oefficients t Sig. B Std. Error Beta (Constant) - .520 .081 - 6.407 .000 Travel time d ifference - .007 .001 - .321 - 12.071 .000 Fare difference - .031 .002 - .335 - 12.627 .000 Access time d ifference - .018 .002 - .265 - 10.081 .000 Waiting time - .004 .003 - .030 - 1.232 .218 Access m ode’s fare .010 .005 .049 2.028 .043 Model Penang Train R= .389, Adj. R Square= .149, R Square Change= .152 and F (5, 1434) = 51.214 (III) Sensitivity analysis The purpose of the analysis is to determine the probability of intercity bus preference toward the changes of each parameter. For the sensi tivity analysis, the initial conditions for each parameter were set to be as written in Table 9. Table 9 . The initial conditions of intercity mode (bus/train) services Intercity bus/train service KL - JB KL - Penang Access time to intercity bus terminal 15 minutes 15 minutes Access time to intercity train station 15 minutes 15 minutes Intercity bus travel time 4.5 hours 5.5 hours Intercity train travel time 8 Hours 8.5 hours Intercity bus fare $10.30 $10.76 Intercity train fare $13.69 $13.04 Re garding the analysis result in T able 5, 6, 7 and 8 , it is proven that in both corridors (KL - Penang and KL - JB), attributes of ‘travel time difference’, ‘fare difference’, and ‘access time to intercity terminal difference’ are significantly influence bus m ode preference. Actually the effect of each attribute based on bus user perception can be discussed separately by using sensitivity analysis. Sensitivity graphs (Figure 9, 10 and 11) indicate that for both corridors, intercity bus service value changes eff ect (travel time, fare and access time attribute) is higher than the train service value changes effect (travel time, fare and access time attribute). Figure 9. Sensitivity of bus preference toward travel time attribute Figure 10. Sensitivity of bus preference toward fare attribute 0 . 00 0 . 10 0 . 20 0 . 30 0 . 40 0 . 50 0 . 60 0 . 70 0 . 80 0 . 90 1 . 00 - 200 . 0 - 150 . 0 - 100 . 0 - 50 . 0 0 . 0 50 . 0 100 . 0 Probability of choosing Intercity bus Travel time Difference ( Minutes) Sensitivity Toward Travel Time Atributte Sensitivity on bus travel time changes (all respondents) KL - Penang Bus Travel Time Value Changes (All Respondents) KL - Johor Bahru Train Travel Time Value Changes ( All respondents) KL - Penang Train Travel Time Value Changes (All Respondents) KL - Johor Bahru 0 . 00 0 . 10 0 . 20 0 . 30 0 . 40 0 . 50 0 . 60 0 . 70 0 . 80 0 . 90 - 15 . 0 - 10 . 0 - 5 . 0 0 . 0 5 . 0 10 . 0 15 . 0 20 . 0 25 . 0 Probability of choosing Intercity bus Fare difference (RM) Sensitivity Toward Fare Atributte Sensitivity on bus fare changes (all respondents) KL - Penang Bus Fare Changes (All Respondents) KL - Johor Bahru Train Fare Value Changes ( All Respondents) KL - Penang Train Fare Value Changes ( All respondents) KL - Johor Bahru Figure 11. Sensitivity of bus preference toward access time attribute (IV) Travel time attribute The travel time attribute changes were evaluated using both scenario of intercity train service and bus service for both KL - Penang and KL - JB corridor. As for details, see Figure 9, the graphs for sensitivity of bus preference toward the changes of travel time. The axis value in that figure is the difference between bus travel time and train travel time and the ordinate valu e is bus preference probability. In KL - JB corridor, when the scenario of intercity bus service involved, bus preference probability decreased 67.4% in the range travel time difference of ( - 150) minutes to 75 minutes. When the scenario of intercity train service involved, bus preference probability decreased 43.5% in the range travel time difference of ( - 150) minutes to 75 minutes. In KL - Penang corridor, when the scenario of intercity bus service involved, bus preference probability decrease 58.9% in the range travel time difference of ( - 150) minutes to 75 minutes. When the scenario of intercity train service involved, bus preference probability decreased 36.5% in the range travel time difference of ( - 150) minutes to 75 minutes. The distance from KL to Pen ang is not much different when using the bus or train, but the bus travel time is shorter than the train because the average bus speed is higher (98 kph) than the train (60 kph). In addition, bus stops are only for loading unloading passengers. For unloadi ng passengers, the bus stops depend on demand. This is lower compared, to the train (12 - 19 stops). From this result, it is implied that bus users would probably be attracted by the efforts of KTMB to cut the total travel time on the rail line. Shortening t he total train travel time can be achieved by reducing the riding time, waiting time or stopping time. The effort to cut intercity train riding times by upgrading the rail track to support the speed (from 60 kph) of the new ETS (average on 90 kph) is still ongoing. Efforts to shorten the waiting time are quite challenging since the train has a low departure frequency and departing time reliability. Respondents usually prefer to arrive at an intercity mode terminal before the departure time. This makes resp ondents feel there is a longer waiting time than their actual waiting time. Indeed, the bus waiting time is usually shorter than the train, and the times of bus departures are more reliable than the train. KTMB 0 . 00 0 . 10 0 . 20 0 . 30 0 . 40 0 . 50 0 . 60 0 . 70 0 . 80 0 . 90 - 50 . 0 0 . 0 50 . 0 100 . 0 150 . 0 Probability of choosing Intercity bus Access Time Difference (Minutes) Sensitivity Toward Access Time Attribute Sensitivity on access time to bus terminal changes (all respondents) KL - Penang Access Time to Bus Terminal Changes (All Respondents) KL - Johor Bahru Access Time to Train Station Value Changes (All respondents) KL - Penang Access Time to Train Station Value Changes ( All Respondents) KL - Johor Bahru currently only allows train users to wait on the platform 30 minutes before the departure time. This is considered a good strategy for eliminating the users’ perception of a longer waiting time than their actual waiting time. The effort to shorten train service stopping times (which been implemented on ETS) would probably attract intercity travelers, but something that the service provider should not forget is that offering passengers a train service with fewer stops will reduce passenger travel time but may require higher train frequency and higher operating costs. It would also cause the train fare to rise, which is not really favorable to the passengers. However, it seems that the provision of public services is constrained by the availability of money, knowledge, manpower and materials (Marsden & Bonsall, 2006). The result of those two lines models indicates a stronger effect of intercity bus travel time chang es on the bus preference probability. Bus users may be worried about the longer travel time of their current intercity mode, for example while the road is congested. Therefore, the bus user response to the scenario is more obvious and shows them switching to the train. Eventually, the current phenomenon is a high demand for road infrastructure because of the low public transport modal share which contributes to traffic congestion. This is a big challenge for SPAD and the bus industry in the future. Bus user s have a different perception on the changing travel time attributes. There may be another consideration for a bus user to voluntarily move from their current mode to an intercity train if bus travel times were changed. Comfort can probably be a considerat ion. Many intercity travelers stated they preferred the intercity bus because of shorter travel time. In interview sections, bus users argued that they do not feel comfortable sitti ng in the train because of its long travel time. When there was no optional mode except for the train, bus users would prefer sleeping in a coach to deal with the train’s long travel time. Although it requires a higher travel cost, users can feel comfort during the journey. Based on interviews with some other respondents, they ar gued that it is better to take the bus when a traveler needs to get to destination faster, but if the traveler prefers to enjoy the journey, it is better to take a train and get the sleeping coach. Moreover, they argued that the worse performance of buses was during the festive season when it is subjected to congested roads. From the analysis results, which are supported by respondent arguments, it is clearly pr edicted that changes in travel time attributes would result in a strong effect on the bus prefere nce in the future. (V) Fare attribute Figure 10 shows the sensitivity of bus preference to fare attribute changes. The x - axis represents the fare difference between the intercity bus and train in Ringgit Malaysia (RM). From Figure 10 it is implied that bus us ers would really be concerned about fare increments of their current mode, but they would expect a lot from a train fare reduction. In an economic perspective, there is supposed to be no difference to the money the respondents spent, whether using the inte rcity bus company or the intercity train company. But based on the sensitivity result, bus users have a different perception to the value of the intercity bus and train fare changes. It was an interesting result that setting an equal fare on intercity bus and train services provides no evidence that it would create a similar ridership attraction. There may be a reason for users’ different perspective this case, which is not included in the model. Probably it is related to the additional feeder transport mod e costs needed to access an intercity mode terminal. (VI) Access time attribute Figure 11 shows the sensitivity of bus preferences to access time attribute changes. The x - axis represents the time difference between accessing the intercity bus terminal and the intercity train station in minutes. The gap between these two lines for both KL - Penang and KL - JB corridors was not really obvious. It is implied that bus users would show similar reaction towards changes in the access time attributes fo r these two interc ity modes. Feeder public service improvement is currently a big issue and is being used to promote intercity land public transport usage. The Government has declared a vision for comprehensive and efficient transportation system networks with good inter an d intra city linkages in Malaysia (DBKL, 2011). A transport hub to facilitate commuting to the North, South and East of Peninsular Malaysia is urgently required. 5. CONCLUSION The impact of certain policies can be quite far reaching and this has also be en experienced in the case of mode choice. The policy on having better roads connecting major cities in Malaysia through the construction of high quality expressways between large cities and urban areas affect the preference of road transport mode. In spe cific, for both corridors (KL - Penang and KL - JB), attributes of ‘travel time difference’, ‘fare difference’, and ‘access time difference’ can help to explain the high bus performance compared to the train in Malaysia. T he increasing value of bus travel ti me, bus fare and access time attributes will decrease the value of the intercity bus utility. Based on the perception of bus user, changes on bus service attribute s will be much higher affecting the bus preference rather than the changes on train service a ttribute s . The analysis results indicate a stronger effect of intercity bus travel time changes on the bus preference probability. I t is implied that bus users may be worried about the longer travel time of their current mode, but they are probably attract ed by the efforts to shorten the total train travel time (by reducing riding time, waiting time or stopping time). Similarly, shifting from bus to the train would probably occur because of fare reduc tion of intercity train, but the impact of shifting will probably stronger when the policy of bus fare increment taken. And finally , bus users would show similar reaction towards changes in the access time attributes for these two intercity modes. It is now well understood that the bus has become a predominant i ntercity transport mode in this country. To increase ridership of intercity trains, a certain level of service should be designed related to these four attributes. The approaches of this study will hopefully be a platform for public transport service impro vement in order to face intercity land public transport competition in the future. REFERENCES Abdul, M., Ibrahim, Y., & Hun, G. M. (2008) Case 5, Keretapi Tanah Melayu Bhd. Asian Journal of Case Research , 1(2), 163 – 182 . Ahe rn, A. A., & Tapley, N. (2 008) The use of stated preference techniques to model modal choices on interurban trips in Ireland. Transportation Research Part A: Policy and Practice , 42(1), 15 - 27. Correnti, V., Caprì, S., Ignaccolo, M., & Inturri, G. (2007) The potential of rotorcraft for intercity passenger transport. Journal of Air Transport Management , 13(2), 53 - 60. doi: 10.1016/j.jairtraman.2006.11.009 . Crisalli, U. (1999) User's behaviour simulation of intercity rail service choices. Simulation Practice and Theory , 7(3), 233 - 249. doi: 10.1016/s0928 - 4869(99)00004 - x . Cullinane, S. (2002) The relationship between car ownership and public transport provision: A case study in Hongkong. Transport Policy , 9, 29 - 39. Cullinane, S., & Cullinane, K. (2003). Car dependence in a public transpo rt dominated city: evidence from Hong Kong. Transportation Research Part D: Transport and Environment , 8(2), 129 - 138. Clever, R. and Mark M. H., (2008) The Interaction of Air and Rail in Japan, Transportation Research Record , 2043, 1 - 12. Departments of Sta tistics, M. (2010) Population, Household & Living Quarters . Department of Statistics. (2011) Statistics Handbook Malaysia . Retrieved from http ://www.statistics.gov.my/portal/download_Handbook/files/BKKP/Buku_Maklumat_Perangkaan_2011. pdf . Dewan Bandaraya Kuala Lumpur. (2011) Transportation . Retrieved from http://www.dbkl.gov.my/pskl2020/english/transportation/index.htm Geurs, K. T., & Wee, B. V. (2004) Accessibility evaluation of land - use and transport strategies: review and research directions. Journal of Transport Geography 12, 127 – 140. Gutiérrez, J., & Urbano, P. (1996) Accessibility in the European Union: the impact of the trans - European roa d network. Journal of Transport Geography , 4(1), 15 - 25. doi: 10.1016/0966 - 6923(95)00042 - 9 Hen sher, D. A & Prioni, P. (2002) A service quality index for area - wide contract performance assessment. Journal of Transport Economics and Policy , 36(1), 93 - 113. Kua la Lumpur Structure Plan 2020 (2010) Retrieved from http://www.dbkl.gov.my/pskl2020/english/transportation/index.htm. Hu, K. C., & Jen, W. (2007) Passengers’ behavioral intentions for intercity bus service in Taiwan: Application and Comparison of The Lisre land Neural Networks. Journal of the Eastern Asia Society for Transportation Studies , 7, 486 - 498. Jabatan Kerja Raya. (2008) Road traffic volume Malaysia 2008. [CD ROOM]. Kuala Lumpur: Highway Planning Unit. Jabatan Perancangan Bandar dan Des a Semenanjung Malaysia. (2005) National Physical Plan. Kuala Lumpur, Malaysia. Kot tenhoff, K. & Lindh, C. (1995) The value and effects of introducing high standard train and bus concepts in Blekinge, Sweden. Transport Policy, 2, 235 - 241. Kumar, N. (2008) International i nfrastructure development in east asia – towards balanced regional development and integration. ERIA Research Project Report 2007 - 2. Retrieved from: http://www.eria.org/publications/research_project_reports/images/pdf/PDF%20No.2/No.2 - part2 - 7.Ma laysia.pdf Mars den, G., & Bonsall, P. (2006). Performance targets in transport policy. Transport Policy, 13 (3), 191 - 203. Projek Lebuhraya Utara - Selatan. (2011a) The North - South Expressway. Retrieved Marc 27, 2012, from http://www.plus.com.my/index.php?id=nse Projek Le buh raya Utara - Selatan. (2011b) The Butterworth - Kulim Expressway. Retrieved February 13, 2012, from http://www.plus.com.my/index.php?id=bke Ribeiro, S. K., Kobayashi, S., Beuthe, M., Gasca, J., Greene, D., Lee, D. S., ... Zhou, P. J. (2007). Transport and its infrastructure. In Climate Change 2007: Mitigation. Contribution of Working Group III to the Fourth Assessment Report of the Intergovernmental Panel on Climate Change. Cambridge University Press, Cambridge, UK and New York, USA. Sivakumar, T., Yabe, T., Oka m ura, T., & Nakamura, F. (2006) Survey design to grasp and compare user’s attitudes on bus rapid transit (BRT) in developing countries. Retrieved from http://www.iatss.or.jp/pdf/research/30/30 - 2 - 05.pdf The Star News (2010) Retr ieved from: http://thestar.co m.my/news/ story.asp?file=/2011/1/2/nation/ Wee, B. V., Hago ort, M. & Annema, J. A. (2001) Accessibility measures with competition. Journal of Transport Geography , 9(3), 199 - 208. doi: 10.1016/s0966 - 6923(01)00010 - 2 Kereta pi Tanah Melayu Berhad. (2012) Retrie ved from http://www.ktmb.com.my/ Suruhanjaya Pengangkutan Awam Darat (2011) Retrieved from : http://www.spad.gov.my/news - events/media - releases/2010/perlantikan - pengerusi - suruhanjaya - pengangkut an - awam - darat Nurdden, A., Rahmat, R. A., & Ismail , A. (2007) Eff ect of transportation policies on modal shift from private car to public transport in Malaysia. Journal of the Applied Sciences , 7(7), 1013 - 1018. Yang, L., Choudhury, C. F., & Ben - Akiva, M. (2009) Stated Preference Survey for New Smart Transport Modes and Services: Design, Pilot Study and New Revision (I. T. S. Lab, D. o. C. a. E. Engineering & M. I. o. Technology, Trans.) Working Paper Series: Instituto Superior Tecnico, Universidade Tecnica de Lisbon, Protugal. Fare Competition (USD/ one way) In vehicle time Competition (hours) Access time (hours) Egress time (hours) Total travel time (hours) KL - Johor Bharu Automobil e Air Rail 3.35.838.642.630.540.540.390.290.251.178.00.923.35.018.5713.1044.9450.94 Intercity Mode Fare (USD/ one way) In vehicle time (hours) Access time (hours) Egress time (hours) Total travel time (hours) KL - Penang Automobile Air Rail Bus 5.58.833.086.221.170.250.2915.5230.4851.235.678.50.835.513.050.260.081.08 4.7% 2.8% 38.0% 91.2% 96.3% 26.9% 100.0% 4.2% 0.9% 35.1% KL - Penang Access time (hours) In vehicle time (hours) Egress time (hours) 5.0% 2.9% 44.5% 85.8% 92.6% 35.0% 100.0% 9.3% 4.5% 20.5% Bus Rail Air Automobile KL - Johor Bharu Access time (hours) In vehicle time (hours) Egress time (hours) 63% 37% 27% 73% 22% 77% 2% 3% 13% 27% 15% 22% 17% 3% 0% 10% 20% 30% 40% 50% 60% 70% 80% 90% Below 25 Years old Above 25 Years old Male Female Married Single Divorced Every day Every week Every month Every semester Once a year Rare Un certain Respo ndent s Age Gend er Marital Status Intercity Traveling Frequency KL - Penang KL - JB 17% 10% 2% 3% 67% 2% 12% 28% 53% 7% 0% 10% 20% 30% 40% 50% 60% 70% 80% Proffesional Staff Technical staff / skilled worker Managerial position Un Empoyed Student Pension Working & business purpose Educational Social visit & recreation Others purpose Occupation Trip purpose KL - Penang KL - JB 10% 17% 8% 43% 5% 13% 3% 40% 18% 30% 10% 2% 13% 15% 17% 55% 0% 10% 20% 30% 40% 50% 60% safety comfort travel time fare the availability of intercity mode feeder transport accessibility other personal reason Train Plane Private Car Motorcycle No alternative not so important Quite important important very important The reason for taking intercity bus Alternative mode for intercity traveling The distance to terminal effect perception KL - Penang KL - JB 0 . 0 % 10 . 0 % 20 . 0 % 30 . 0 % 40 . 0 % 50 . 0 % 60 . 0 % Monthly Income (USD) Budget for transportation (USD) Budget for intercity travelling (USD) Uncertain;8.3%$ .3.0%$ 16$ 32.6;.8%$ 65.2;8.3%&#x 59.;M $ ;7.5% $ ;9.$ 65$ 97;9.&#x-2.0;؀ $ ;3.$ 322$ 322$ 977$ 977;9.$ 16$ 32.6;$ 65.2; 0.0.0.0.0.0.0.0.0.0.1..0-.0-.0-.00.0.0.0 Probability of choosing Intercity bus Travel time Difference ( Minutes) Sensitivity Toward Travel Time Atributte Sensitivity on bus travel time changes (all respondents) KL - Penang Bus Travel Time Value Changes (All Respondents) KL - Johor Bahru Train Travel Time Value Changes ( All respondents) KL - Penang Train Travel Time Value Changes (All Respondents) KL - Johor Bahru 0.0.0.0.0.0.0.0.0.0..0-.0-5.00.05.0.0.0.0.0 Probability of choosing Intercity bus Fare difference (RM) Sensitivity Toward Fare Atributte Sensitivity on bus fare changes (all respondents) KL - Penang Bus Fare Changes (All Respondents) KL - Johor Bahru Train Fare Value Changes ( All Respondents) KL - Penang Train Fare Value Changes ( All respondents) KL - Johor Bahru 0.0.0.0.0.0.0.0.0.0..00.0.0.0.0 Probability of choosing Intercity bus Access Time Difference (Minutes) Sensitivity Toward Access Time Attribute Sensitivity on access time to bus terminal changes (all respondents) KL - Penang Access Time to Bus Terminal Changes (All Respondents) KL - Johor Bahru Access Time to Train Station Value Changes (All respondents) KL - Penang Access Time to Train Station Value Changes ( All Respondents) KL - Johor Bahru �� &#x/Att;¬he; [/; ott;&#xom ];&#x/Typ; /P; gin; tio;&#xn 00;&#x/Att;¬he; [/; ott;&#xom ];&#x/Typ; /P; gin; tio;&#xn 00; &#x/MCI; 0 ;&#x/MCI; 0 ;Hong Kong. Transportation Research Part D: Transport and Environment, 8(2), 129Clever, R. and Mark M. H., (2008) The Interaction of Air and Rail in Japan, Transportation Research Record2043, 1Departments of Statistics, M. (2010) Population, Household & Living QuartersDepartment of Statistics. (2011) Statistics Handbook Malaysia. Retrieved from http://www.statistics.gov.my/portal/download_Handbook/files/BKKP/Buku_Maklumat_Perangkaan_2011.Dewan Bandaraya Kuala Lumpur. (2011) Transportation. Retrieved from http://www.dbkl.gov.my/pskl2020/english/transportation/index.htmGeurs, K. T., & Wee, B. V.(2004) Accessibility evaluation of landuse and transport strategies: review and research directions. Journal of Transport Geography12, 127140. Gutiérrez, J., & Urbano, P. (1996) Accessibility in the European Union: the impact of the transEuropean roanetwork. Journal of Transport Geography, 4(1), 1525. doi: 10.1016/09666923(95)00042sher, D. A & Prioni, P. (2002) A service quality index for areawide contract performance assessment. Journal of Transport Economics and Policy, 36(1), 93113.Kuala Lumpur Structure Plan 2020 (2010) Retrieved from http://www.dbkl.gov.my/pskl2020/english/transportation/index.htm.Hu, K. C., & Jen, W. (2007) Passengers’ behavioral intentions for intercity bus service in Taiwan: Application and Comparison of The Lisreland Neural Networks. Journal of the Eastern Asia Society for Transportation Studies, 7, 486Jabatan Kerja Raya. (2008) Road traffic volume Malaysia 2008. [CD ROOM]. Kuala Lumpur: Highway Planning Unit.Jabatan Perancangan Bandar dan Desa Semenanjung Malaysia. (2005) National Physical Plan. Kuala Lumpur, Malaysia.Kottenhoff, K. & Lindh, C. (1995) The value and effects of introducing high standard train and bus concepts in Blekinge, Sweden. Transport Policy, 2, 235241.Kumar, N. (2008) International infrastructure development in east asiatowards balanced regional development and integration. ERIA Research Project Report 20072. Retrieved from:http://www.eria.org/publications/research_project_reports/images/pdf/PDF%20No.2/No.2part27.Malaysia.pdfMarsden, G., & Bonsall, P. (2006). Performance targets in transport policy. Transport Policy, (3), 191203.Projek Lebuhraya UtaraSelatan. (2011a) The NorthSouth Expressway. Retrieved Marc 27, 2012, from http://www.plus.com.my/index.php?id=nse Projek Lebuhraya UtaraSelatan. (2011b) The ButterworthKulim Expressway. Retrieved February 13, 2012, from http://www.plus.com.my/index.php?id=bkeRibeiro, S. K., Kobayashi, S., Beuthe, M., Gasca, J., Greene, D., Lee, D. S., ... Zhou, P. J. (2007). Transport and its infrastructure. In Climate Change 2007: Mitigation. Contribution of Working Group III to the Fourth Assessment Report of the Intergovernmental Panel on Climate Change. Cambridge University Press, Cambridge, UK and New York, USA.Sivakumar, T., Yabe, T., Okaura, T., & Nakamura, F. (2006) Survey design to grasp and compare user’s attitudes on bus rapid transit (BRT) in developing countries. Retrieved from http://www.iatss.or.jp/pdf/research/30/3005.pdfThe Star News (2010) Retrieved from:http://thestar.com.my/news/story.asp?file=/2011/1/2/nation/Wee, B. V., Hagoort, M. & Annema, J. A. (2001) Accessibility measures with competition. Journal of Transport Geography, 9(3), 199208. doi: 10.1016/s09666923(01)00010Keretapi Tanah Melayu Berhad. (2012) Retrieved from http://www.ktmb.com.my/Suruhanjaya Pengangkutan Awam Darat (2011) Retrieved fromhttp://www.spad.gov.my/newsevents/mediareleases/2010/perlantikanpengerusisuruhanjayapengangkutawamdaratNurdden, A., Rahmat, R. A., & Ismail, A. (2007) Effect of transportation policies on modal shift from private car to public transport in Malaysia. Journal of the Applied Sciences, 7(7), 10131018.Yang, L., Choudhury,C. F., & BenAkiva, M. (2009) Stated Preference Survey for New Smart Transport Modes and Services: Design, Pilot Study and New Revision (I. T. S. Lab, D. o. C. a. E. Engineering & M. I. o. Technology, Trans.) Working Paper Series: Instituto Superior Tecnico, Universidade Tecnica de Lisbon, Protugal. Proceedings of the Eastern Asia Society for Transportation Studies, Vol.9, 2013 �� &#x/Att;¬he; [/; ott;&#xom ];&#x/Typ; /P; gin; tio;&#xn 00;&#x/Att;¬he; [/; ott;&#xom ];&#x/Typ; /P; gin; tio;&#xn 00; &#x/MCI; 0 ;&#x/MCI; 0 ;represents the time difference between accessing the intercity bus terminal and the intercity train station in minutes. The gap between these two lines for both KLPenang and KLJB corridors was not really obvious. It is implied that bus users would similarreaction towards changes in the access time attributes for these two intercity modes.Feeder public service improvement is currently a big issue and is being used to promote intercity landpublic transport usage. The Government has declared a vision for comprehensive and efficient transportation system networks with good inter and intra city linkages in Malaysia (DBKL, 2011). A transport hub to facilitate commuting to the North, South and East of Peninsular Malaysia is urgently required.5. CONCLUSIONThe impact of certain policies can be quite far reaching and this has also been experienced in the case of mode choice. The policy on having better roads connecting major cities in Malaysia through the construction of high quality expressways between large cities and urban areas affect the preference of road transport mode. In specific, forboth corridors (KLPenang and KLJB), attributes of ‘travel time difference’, ‘fare difference’, and ‘access time difference’ can help to explain the high bus performance compared to the train in Malaysia. he increasing value of bus travel time, bus fare and access time attributes will decrease the value of the intercity bus utility. Based on the perception of bus user, changes on bus service attributewill be much higher affecting bus preference rather than the changes on train service attributeThe analysis results indicate a stronger effect of intercity bus travel time changes on the bus preference probability. It is implied that bus users may be worried about the longer travel time of their current mode, but they are probably attracted by the efforts to shorten the total train travel time (by reducing riding time, waiting time or stopping time). Similarly, shifting from bus to the train would probably occur because of fare reductionof intercity train, but the impact of shifting will probably stronger when the policy of bus fare increment taken. finallybus users would show similar reaction towards changes in the access time attributes for these two intercity modes.It is now well understood that the bus has become a predominant intercity transport mode in this country. To increase ridership of intercity trains, a certain level of service should be designed related to these four attributes. The approaches of this study will hopefully be a platform for public transport service improvement in order to face intercity land public transport competition in the future. REFERENCESAbdul, M., Ibrahim, Y., & Hun, G. M. (2008)Case5, Keretapi Tanah Melayu Bhd. Asian Journal of Case Research, 1(2), 163 Ahern, A. A., & Tapley, N. (2008) The use of stated preference techniques to model modal choices on interurban trips in Ireland. Transportation Research Part A: Policy and Practice, 42(1), 1527. Correnti, V., Caprì, S., Ignaccolo, M., & Inturri, G. (2007) The potential of rotorcraft for intercity passenger transport. Journal of Air Transport Management, 13(2), 5360. doi: 10.1016/j.jairtraman.2006.11.009Crisalli, U. (1999) User's behaviour simulation of intercity rail service choices. Simulation Practice and Theory7(3), 233249. doi: 10.1016/s09284869(99)00004Cullinane, S. (2002) The relationship between car ownership and public transport provision: A case study in Hongkong. Transport Policy, 9, 2939. Cullinane, S., & Cullinane, K. (2003). Car dependence in a public transport dominated city: evidence from Proceedings of the Eastern Asia Society for Transportation Studies, Vol.9, 2013 �� &#x/Att;¬he; [/; ott;&#xom ];&#x/Typ; /P; gin; tio;&#xn 00;&#x/Att;¬he; [/; ott;&#xom ];&#x/Typ; /P; gin; tio;&#xn 00; &#x/MCI; 0 ;&#x/MCI; 0 ;currently only allows train users to wait on the platform 30 minutes before the departure time. This is considered a good strategy for eliminating the users’ perception of a longer waiting time than their actual waiting time. The effort to shorten train service stopping times (which been implementedon ETS) would probably attract intercity travelers, but something that the service provider should not forget is that offering passengers a train service with fewer stops will reduce passenger travel time but may require higher train frequency and higher operating costs. It would also cause the train fare to rise, which is not really favorable to the passengers. However, it seems that the provision of public services is constrained by the availability of money, knowledge, manpower and materials (Marsden & Bonsall, 2006). The result of those two lines models indicates a stronger effect of intercity bus travel time changes on the bus preference probability. Bus users may be worried about the longer travel time of their current intercity mode, for example while the road is congested. Therefore, the bus user response to the scenario is more obvious and shows them switching to the train. Eventually, the current phenomenon is a high demand for road infrastructure because of the low public transport modal share which contributes to traffic congestion. This is a big challenge for SPAD and the bus industry in the future.Bus users have a different perception on the changing travel time attributes. There may be another consideration for a bus user to voluntarily move from their current mode to an intercity train if bus travel times were changed. Comfort can probably be a consideratMany intercity travelers stated they preferred the intercity bus because of shorter travel time. In interview sections, bus users argued that they do not feel comfortable sitting in the train because of its long travel time. When there was no optionalmode except for the train, bus users would prefer sleeping in a coach to deal with the train’s long travel time. Although it requires a higher travel cost, users can feel comfort during the journey.Based on interviews with some other respondents, they argued that it is better to take the bus when a traveler needs to get to destination faster, but if the traveler prefers to enjoy the journey, it is better to take a train and get the sleeping coach. Moreover, they argued that the worse performance of buses was during the festive season when it is subjected to congested roads. From the analysis results, which are supported by respondent arguments, it is clearly edictedthat changes in travel time attributes would result in a strong effect on the bus preference in the future.(V)Fare attributeFigure 10 shows the sensitivity of bus preference to fare attribute changes. The xaxis represents the fare difference between the intercity bus and train in Ringgit Malaysia (RM). From Figure 10 it is implied that bus users would really be concerned about fare increments of their current mode, but they would expect a lot from a train fare reduction. In an economic perspective, there is supposed to be no difference to the money the respondents spent, whether using the intercity bus company or the intercity train company. But based on the sensitivity result, bus users have a different perception to the value of the intercity bus and train fare changes. It was an interesting result that setting an equal fare on intercity bus and train services provides no evidence that it would create a similar ridership attraction. There may be a reason for users’ different perspective this case, which is not included in the model. Probably it is related to the additional feeder transport mode costs needed to access an intercity mode terminal.(VI)Access time attributeFigure 11 shows the sensitivity of bus preferences to access time attribute changes. The xaxis Proceedings of the Eastern Asia Society for Transportation Studies, Vol.9, 2013 Figure 11. Sensitivity of bus preference toward access time attribute(IV)Travel time attributeThe travel time attribute changes were evaluated using both scenario of intercity train service and bus service for both Penang and KLJB corridor. As for details, see Figure 9, the graphs for sensitivity of bus preference toward the changes of travel time. The axis value in that figure is the difference between bus travel time and train travel time and the ordinate value is bus preference probability. In KLJB corridor, when the scenario of intercity bus service involved, bus preference probability decreased 67.4% in the range travel time difference of (150) minutes to 75 minutes. When the scenario of intercity train service involved, bus preference probability decreased 43.5% in the range travel time difference of (150) minutes to 75 minutes.In KLPenang corridor, when the scenario of intercity bus service involved, bus preference probability decrease 58.9% in the range travel time difference of (150) minutes to 75 minutes. When the scenario of intercity train service involved, bus preference probability decreased 36.5% in the range travel time difference of (150) minutes to 75 minutes.The distance from KL to Penang is not much different when using the bus or train, but the bus travel time is shorter than the train because the average bus speed is higher (98 kph) than the train (60 kph). In addition, bus stops are only for loading unloading passengers. For ng passengers, the bus stops depend on demand. This is lower compared, to the train 19 stops).From this result, it is implied that bus users would probably be attracted by the efforts of KTMB to cut the total travel time on the rail line. Shortening the total train travel time can be achieved byreducing the riding time, waiting time or stopping time. The effort to cut intercity train riding times by upgrading the rail track to support the speed (from 60 kph) of the new ETS (average on 90 kph) is stillongoing. Efforts to shorten the waiting time are quite challenging since the train has a low departure frequency and departing time reliability. Respondents usually prefer to arrive at an intercity mode terminal before the departure time. This makes respondents feel there is a longer waiting time than their actual waiting time. Indeed, the bus waiting time is usually shorter than the train, and the times of bus departures are more reliable than the train. KTMB Proceedings of the Eastern Asia Society for Transportation Studies, Vol.9, 2013 �� &#x/Att;¬he; [/; ott;&#xom ];&#x/Typ; /P; gin; tio;&#xn 00;&#x/Att;¬he; [/; ott;&#xom ];&#x/Typ; /P; gin; tio;&#xn 00; &#x/MCI; 0 ;&#x/MCI; 0 ;Re&#x/MCI; 1 ;&#x/MCI; 1 ;garding the analysis result in able 5, 6, 7 and 8, it is proven that in both corridors (KLPenang and KLJB), attributes of ‘travel time difference’, ‘fare difference’, and ‘accesstime to intercity terminal difference’ are significantly influence bus mode preference. Actually the effect of each attribute based on bus user perception can be discussed separately by using sensitivity analysis. Sensitivity graphs (Figure 9, 10 and 11) indicate that for both corridors, intercity bus service value changes effect (travel time, fare and access time attribute) is higher than the train service value changes effect (travel time, fare and access time attribute). Figure 9. Sensitivity of bus preference toward travel time attribute Figure 10. Sensitivity ofbus preference toward fare attribute Proceedings of the Eastern Asia Society for Transportation Studies, Vol.9, 2013 �� &#x/Att;¬he; [/; ott;&#xom ];&#x/Typ; /P; gin; tio;&#xn 00;&#x/Att;¬he; [/; ott;&#xom ];&#x/Typ; /P; gin; tio;&#xn 00; &#x/MCI; 0 ;&#x/MCI; 0 ;(II) &#x/MCI; 1 ;&#x/MCI; 1 ;Scenarios on intercity train serviceRegression model involving scenarios on intercity bus service for KLwas shown in Table and for KLPenang corridor was shown in Table As can be seen from Table 7, all the intercity train service variables involved; travel time (t(196) = 12.22, p .05), fare difference (t(196) = 12.78, p .05), access time difference (t(196) = 10.20, p .05), waiting time (t(196) = 5.73, p .05), access mode’s fare (t(196) = 2.69, p .05) were found significantly to influence intercity bus preference. Table Regression model involving scenarios on intercity train service for KLJB corridor KL JB c orridor S cenarios on intercity train servi ce Unstandardized c oefficients Standardized c oefficients t Sig. B Std. Error Beta (Constant) - .735 .095 - 7.772 .000 Travel time Difference - .009 .001 - 0.43 - 12.216 .000 Fare Difference - .029 .002 - 0.43 - 12.779 .000 Access time to intercity st ation Difference - .018 .002 - 0.36 - 10.202 .000 W aiting t ime .274 .048 - 0.11 5.733 .000 Access m ode’s fare - .019 .007 ` - 0.13 - 2.693 .007 Model JB Train R= .414, Adj. R Square=.172, R Square Change= .971 and F (5, 1434) = 59.407.As can be seen from Table 8, intercity train service variables involved; travel time (t(196) = 12.07, p .05), fare difference (t(196) = 12.63, p .05), access time difference (t(196) = 10.08, p .05), were found significantly to influence intercity bus preference. Thecoefficients for these significance variables: ‘travel time difference’, ‘fare difference’, ‘access time difference’ and ‘access mode fare’ are negative. It means the increasing of these values will decrease the intercity bus preference.Table Regression model involving scenarios on intercity train service for Penang corridor KL Penang c orridor S cenarios on intercity train service Unstandardized c oefficients Standardized c oefficients t Sig. B Std. Error Beta (Constant) - .520 .081 - 6.407 .000 Travel time d ifference - .007 .001 - .321 - 12.071 .000 Fare difference - .031 .002 - .335 - 12.627 .000 Access time d ifference - .018 .002 - .265 - 10.081 .000 Waiting time - .004 .003 - .030 - 1.232 .218 Access m ode’s fare .010 .005 .049 2.028 .043 Model Penang Train R= .389, Adj. R Square=.149, R Square Change= .152and F (5, 1434) = 51.214Sensitivity analysisThe purpose of the analysis is to determine the probability of intercity bus preference toward the changes of each parameter. For the sensitivity analysis, the initial conditions for each parameter were set to be as written in TableTable . The initial conditions of intercity mode (bus/train) services Intercity bus/train service KL - JB KL - Penang Access time to intercity bus terminal 15 minutes 15 minutes Access time to intercity train station 15 minutes 15 minutes Intercity bus travel time 4.5 hours 5.5 hours Intercity train travel time 8 Hours 8.5 hours Intercity bus fare $10.30 $10.76 Intercity train fare $13.69 $13.04 Proceedings of the Eastern Asia Society for Transportation Studies, Vol.9, 2013 �� &#x/Att;¬he; [/; ott;&#xom ];&#x/Typ; /P; gin; tio;&#xn 00;&#x/Att;¬he; [/; ott;&#xom ];&#x/Typ; /P; gin; tio;&#xn 00; &#x/MCI; 0 ;&#x/MCI; 0 ;4.2.3. Stated preference data analysisScenarios on intercity bus serviceRegression model involving scenarios on intercity bus service for KLJB was shown in Table and for KLPenang corridor was shown in Table . As shown in KLJB corridor (Table ), when the scenario on bus service changes applied, travel time difference (t(196) = 18.22, p .05), fare difference (t(196) = 26.69, p .05), access time difference (t(196) = 14.68, p .05), waiting time (t(196) = 5.11, p .05were found significantly influence the bus preference. While access mode’s fare were found not significantly influenced the bus preference.As shown in KLPenang corridor (Table ), when the scenario on bus service changes applied, travel time difference (t(196) = 18.06, p .05), fare difference (t(196) = 26.46, p .05), access time difference (t(196) = 14.55, p .05) were found significantly influence the bus preference. But the waiting time and access mode’s fare were found not significantly fluencethe bus preference.Table Regression model involving scenarios on intercity bus service for KLJB corridor KL JB c orridor S cenarios on intercity bus service Unstandardized c oefficients Standardized c oefficients t Sig. B Std. Error Beta (Constant) - 1.449 .095 - 15.228 .000 Travel time Difference - .015 .001 - .405 - 18.217 .000 Fare Difference - .069 .003 - .591 - 26.693 .000 Access time Difference - .023 .002 - .323 - 14.675 .000 Waiting Time .212 .041 .105 5.117 .000 Access Mode’s fa re .008 .006 .028 1.346 .178 Model JB Bus R= .608, Adj. R Square=.367, R Square Change= .369, and F(5, 1494) = 174.865Table Regression model involving scenarios on intercity bus service for KL Penang corridor KL Penang c orridor S cenarios on i ntercity bus service Unstandardized c oefficients Standardized c oefficients t Sig. B Std. Error Beta (Constant) - 1.043 .087 - 12.055 .000 Travel time Difference - .012 .001 - .405 - 18.058 .000 Fare Difference - .066 .003 - .591 - 26.460 .000 Access time to intercity terminal Difference - .023 .002 - .323 - 14.547 .000 Waiting Time .001 .003 .007 .323 .746 Access Mode’s fare .005 .004 .023 1.111 .267 Model Penang Bus R= .598, Adj. R Square=.358, R Square Change = .358 and F (5, 1494) = 166.639. ased on stated preference data in the model result, the coefficients for ‘travel time difference’, ‘fare difference’, and ‘access time difference’ scenario are negative. It means the increasing of these values will decrease the intercity bus preference.interesting result is intercity bus feeder mode fare (access) and waiting time in the terminal/station is found significantly decrease the probability for bus preference. Moreover, the coefficients for waiting time and access mode fare are positive. It means the increasing of these values will increase the intercity bus preference. It is rationally unacceptable. Based on this conditionit feeder access mode fareand waiting time should be excluded from the model. Thus the waiting time and access mode fare would be no longer considers to influence the bus preference. Proceedings of the Eastern Asia Society for Transportation Studies, Vol.9, 2013 �� &#x/Att;¬he; [/; ott;&#xom ];&#x/Typ; /P; gin; tio;&#xn 00;&#x/Att;¬he; [/; ott;&#xom ];&#x/Typ; /P; gin; tio;&#xn 00; &#x/MCI; 0 ;&#x/MCI; 0 ;bus as an access mode. Others (25% and 15%) prefer LRT/ Commuter train.Similarly, for egressmode, private vehicle is still being the main feeder mode in both KLJB and KLPenang corridors (41.7% & 36.7%). Commuter bus and taxi are public feeder transport in Larkin intercity terminal (in JB). But in these two corridors, the commuter bus (6.7% and 16.7%) is not as as taxi (35% and 21.7%).Crisalli (1999) argued that, feeder transport service to the intercity terminal also affects the intercity traveller on choosing their intercity transport mode choice Crisalli, 1999. This ield survey interview found the similar result. Amounts of 13.3% (KLJB) and 8.3% (KLnang) respondents argued to state that feeder service is important for them in deciding what intercity mode to prefer; whether bus or train. A better access to its station is an advantage offered by train. For example in KL, train station is located insidethe KL central building in Kuala Lumpur city, while in JB train station is inside the JB central building. ome intercity passengers avoid taking certain mode because of its poor access to the terminal, i.e. Duta bus terminal. Thereare only twooptionfor feeder public transport mode to access Duta terminalcommuter bus or taxi. Duta terminal is quite far from downtown KL. Public transport feeder fare to Duta bus terminal is almost 2 times higher than to intercity train station in city center. Commuterbus as a feeder access mode in Kuala Lumpur normally has a normally long waiting time interval (around 30 minutes). To access Duta terminal, there are only 2 direct commuter bus from city center per day. So the commuter bus waiting time to access Duta terminal is even longer than normal. If the passenger concern about waiting time, the taxi is an option. Taking the taxi from the city center means there will be around RM20 extra costs. The taxi fare can be as expensive as the intercity bus fares itself. BTSis a part of an integrated transport network in Malaysia to resolve the connectivity issues http://transitmy.org. It provides a better public facility and enhancement such as decrease the feeder transport service waiting time. Figure 8 shows the comparison of respondent monthly income, budget for transportation and budget for intercity travelling. Most of respondent’s monthly income in this study is between $ 322.6 and $ 977.8, which most of them spent $ 16.3 $32.6 for transportation and less than $ 16.3 for intercity budget. As Hensher (2007) emphasize that as individuals age and increase their income, individuals see existing service quality as increasingly satisfying their requirements for service quality Hensher, 2007 Figure 8Monthly income, transportation budget and intercity travelling budget Proceedings of the Eastern Asia Society for Transportation Studies, Vol.9, 2013 Figure 7. Traveler perception on the distance to terminal, reason for taking bus, mode alternatives for intercity travellingn deciding to use public transport, respondents usually consider the feeder (access/egress) mode service, the feeder (access/egress) mode time, mode waiting time, the number of transfer, transit fare, and transit pass ownership, and the schedule flexibility Yang, et al., 2009. If there were no available public transport services, private car will be an alternative. Although so, driving own car for intercity travelling wasnot so much of a preference for a long trip, since they should consider fee, toll, transit pass ownership, schedule flexibility and the number of people who shared the trip with them Correia & Antunes, 2012Yang, et al., 2009. Hu and Jen (2007) argue that if invehicletraveltime is considered, customers may choose other intercity bus companies or alternative modes of transport with similar or better service quality but with a lower service sacrifice.This survey found the train as the main competitor of intercity bus (KLPenang 55% & KLJB 40%). Some other respondents prefer to use private car as an alternative of bus (KLPenang 27% & KLJB 30%). Table 4. Feeder transport from/to intercity bus station Feeder transport to/from intercity bus terminal Access Egress KL - JB KL - Penang KL - JB KL - Penang private car 43.3% 36.7% 41.7% 36.7% motorcycle 3.3% 6.7% 5. 0% 6.7% Commuter bus 20.0% 16.7% 6.7% 16.7% LRT/ Commuter Train 25.0% 15.0% 10.0% 15.0% taxi 5.0% 21.7% 35.0% 21.7% others 3.3% 3.3% 1.7% 3.3% Table (feeder transport from/to intercity bus station) shows that private vehicle as the feeder transportmode is accounted for 46.3% for KLJB and 43.4% for KLPenang. However, there is 20% (KLJB) and 16.7% (KLPenang) of the respondent still keen on using commuter Proceedings of the Eastern Asia Society for Transportation Studies, Vol.9, 2013 �� &#x/Att;¬he; [/; ott;&#xom ];&#x/Typ; /P; gin; tio;&#xn 00;&#x/Att;¬he; [/; ott;&#xom ];&#x/Typ; /P; gin; tio;&#xn 00; &#x/MCI; 0 ;&#x/MCI; 0 ;attached as an effect of travel time. In some of interview sections, respondents said not feeling comfortable in the intercity train with its long travel time. Safety seems becoming the reason only by 10% of respondents (KLJB) and 13.3% of respondents (KLPenang). Figure 5Respondentage, gender, maral status Figure 6Respondentoccupation and trip purposeRespondents travelling perceptions of particular intercity modes and traveller attitudes may affect their preference and choices Correia & Antunes, 2012Yang, et al, 2009. The distance to terminal also affects the intercity traveler perception in choosing an intercity transport mode. A longer distance usually related to a longer access time for feeder mode service. Only 13.3% (KLJB) and 10% (KLPenang) of the respondent mentioned that the distance to terminal is not important for them to decide what intercity mode to use (Figure 7). Proceedings of the Eastern Asia Society for Transportation Studies, Vol.9, 2013 �� &#x/Att;¬he; [/; ott;&#xom ];&#x/Typ; /P; gin; tio;&#xn 00;&#x/Att;¬he; [/; ott;&#xom ];&#x/Typ; /P; gin; tio;&#xn 00; &#x/MCI; 0 ;&#x/MCI; 0 ;Lackof public facilities and route coverage limitation has force intercity passenger to transfer several times to access an intercity bus terminal. Bus terminals should be constructed with foresight, from good accessibility to well thought out and planned location thestar.com.my. It should be assigned to a single agency to manage the system.Improvements arecurrentlybeing made to enhance public transport accessibility. New integratedterminals for land public transport are being developed as transport hubs to facilitate commuting to the North, South and East of Peninsular Malaysia. All three integrated transport hubs will ultimately replace existing interstate terminals across Kuala Lumpur. The integrated terminal in Bandar Tasik Selatan (BTS) caters for southbound movements (has just been completed and is in operation in March 2011), while the Sungai Buloh terminal is for northbound and the Gombak terminal is for eastbound buses (expected to be completed in 2011 and operated by 2012). The accessibility for feeder transport would be a big challenge for intercity bus in the future intercity land transport competition4.2.2. Socioeconomic, demographicand travel behaviour characteristic analysisIn exploring intercity bus preference based on respondents behaviour characteristics, some of variables are considered; such as: alternative mode for intercity travelling, traveler perception on the distance to terminal, reason for taking bus intercity mode travel time, intercity mode fare, respondents age, marital status, gender, occupation, monthly income, for feeder mode, travel time for intercity bus feeder mode (access), total travel time of feeder mode(access), intercity bus feeder mode fare (access), travel time in intercity bus feeder mode (egress), total travel time of feeder mode (egress), intercity bus feeder mode fare (egress) and waiting time in the terminal/station.A field survey was conducted in three months at several intercity bus terminals and train stations in Kuala Lumpur, Johor Bahru and and Penang. Intercity bus terminals observation included: bus terminal of Bukit Jalil, Puduraya bus terminal, bus terminal of Shah Alam in Kuala Lumpur, Larkin bus terminal in Johor Bharu and Butterworth in Penang. In addition, a field survey has been conducted at intercity train stations, in Kuala Lumpur, Johor Bharu and Penang. results from the field survey reported that the majority age of the respondent is below 25 years old (53.6 and 56.7%) and single (76.7% and 70.0%). In some interview sections involving female respondents (73.3% and 46.7%), they said that they preferred to use the intercity bus because of shorter bus travel time. They do not feel comfortable being in train for a long time. In this paper, intercity travel was divided into 4 purposes: working & business purpose, educational purposes, recreational/social purposes and other purposes. Working & business purpose and others purpose in this paper are categorized into work travel, while recreational/social purposes and educational and other purposes are categorized into nonwork travel. Regarding the survey result, mostly respondents are dominated by nonwork travelling purpose.Figure6 shows that for both corridors (KL Penang and KL JB), majority of respondent is student (66.7% and 66.7%). As can be seen from Figure 5, the intercity travelling is commonly done every month (26.7% and 30%). Respondents’ major trip purposes are social visit & recreation (53.3% and 50.0%) followed by for educational purpose (28.3% and 41.7%).Figure 7 proves that the fare is the main reason in choosing intercity mode (43% and 30%). The second important factor is comfort (16.7% and 20%), following by travel time (8.3% and 25%) and feeder transport accessibility (13.3% and 8.3%). Comfort can be Proceedings of the Eastern Asia Society for Transportation Studies, Vol.9, 2013 Figure 3The competition of intercity transport travel cost and travel time Figure 3describes that theintercity trainmode has a plus point in accessibility. As the parameters, all the feeder access & egress time (to/from intercity train station) are calculated as the shortest one.In specific, access time to bus terminal for both corridors (feeder mode waiting time +in feeder access mode time) is longer (0.29 hours) than access time to train station (0.25 hours). For KLJB corridor, the feeder mode egress time spentfrom bus terminal feeder mode egress waiting time +in feeder egress mode time)to final destination is 0.54 hours while access time spent from train station to final destination is only 0.39 hours. Similarly, for KLPenang corridor, the feeder mode egress time spent from bus terminal to final destination is 0.26 hours, while accesstime spent from train station to final destination is only 0.08 hours. Figure 4The omponent of time of a total travel time Refers to the fractional time bar in Figure 4, it is proven that the accessibility from/to terminal for intercity train is better than the bus. According to Figure 4 the fraction value of in vehicle time for intercity bus is lower than for intercity train. In details, in vehicle time (intercity train) from KL to Penang is 96.3% of its total travel time, while from KL to JB it is 92.6%. Intercity bus in vehicle time value is 91.2% for KLPenang and 85.8% for KLJB. Proceedings of the Eastern Asia Society for Transportation Studies, Vol.9, 2013 �� &#x/Att;¬he; [/; ott;&#xom ];&#x/Typ; /P; gin; tio;&#xn 00;&#x/Att;¬he; [/; ott;&#xom ];&#x/Typ; /P; gin; tio;&#xn 00; &#x/MCI; 0 ;&#x/MCI; 0 ;excluded, since the east corridors are not wellconnected with the KTMB railways majoroutes. Since all of the intercity modes services only exist in the medium distance corridors, the medium distance is selected as the study area. Thus, the further intercity travelling characteristic from KL to the north corridor (medium distance) is represented by KLPenang corridor and from KL to the south corridor (medium distance) is represented by KLohor ahrucorridor.Table 3. Fare and travel time competition in selected corridors O - D Pairs (From Kuala Lumpur) Average Intercity Mode Fare (RM) Average Intercity Mode Travel Time (Hour) Bus Rail Air Auto - mobile Bus Rail Air Auto - mobile Penang 41.30 46.40 156.00 157.00 4.50 - 5.50 6.50 - 7.50 0.80 3.50 - 4.00 Ipoh 21.30 27.60 - 92.00 2.50 2.00 - 3.00 - 2.00 Kota Bharu 34.00 55.00 137.00 147.00 8.00 - 8.50 12.00 1.00 4.50 - 5.00 Kuala Terengganu 43.00 - 125.00 165.50 8.00 - 0.90 4.50 Kuantan 19.60 - 198.00 107.00 3.50 - 0.70 2.50 Johor Bahru 40.30 54.50 125.50 156.00 4.50 - 5.50 6.50 - 7.50 0.90 3.50 - 4.00 Melaka 12.60 - - 64.00 3.00 - - 1.50 Alor Setar 40.60 50.60 130.00 194.60 5.00 - 7.00 10.00 1.10 4.00 Remarks: 1) Automobile refers to Car 2011, Fuel efficiency 12 km/liter, Fuel price 0.637 USD/liter (Model Car: Proton Saga 1600 cc, Automatic Transmission) 2) Toll fare and fuel consumption are included in automobile fare calculation for single passenger. 3) Exchange Rate in 2011: 1 USD = RM 3.05 4) Bus mode fare refers to average fare for 1st, 2nd and 3rd class 5) Rail mode fare refers to average fare for 1st, 2nd and 3rd class of conventional rail. For Ipoh, ETS was included. 4.2.1. The competition of intercity transport travel time, travel cost and accessibility in Penang and KLJohor Bahru (JB) corridorsComprehensive information regarding intercity trunks and feeder mode service has been derived for the mode competition analysis in the KLPenang corridor. Travel time, fare and feeder mode access time were consistently detected as the reasons to prefer an intercity bus in this case study area. In Figure 3, it can be seen that intercity bus fare is cheaper than the train fare for both corridors of KLPenang and KLJB.The total travel time when travelling by bus is much shorter compare to travelling by train for both corridors of KLPenang and KLJB.Total travel time of travelling by bus along JB is 5.83 hours and KLPenang is 6.22 hours. While total travel time of travelling by train along JB is 8.64 hours and KLPenang is 8.83 hoursBased on Figure 3, the total travel time by bus is shorter than the train. Intercity travel using land public transport would be very much affected by the degree of accessibility to the transport terminals, be it the intercity bus terminal or train terminals. Wee et al. (2001) mention about the importance of accessibility. Accessibility indicator implies the greater or lesser the ease of access to activity center Gutiérrez & Urbano, 1996Accessibility may also influence travel demand as the transport component and the time needed to carry out activities as the temporal component Geurs & Wee, 2004. Appropriate and adequate infrastructure has to be made available for direct and easy access to these terminals, in order for the final door to door travel time between origin and destination can be minimized. Proceedings of the Eastern Asia Society for Transportation Studies, Vol.9, 2013 �� &#x/Att;¬he; [/; ott;&#xom ];&#x/Typ; /P; gin; tio;&#xn 00;&#x/Att;¬he; [/; ott;&#xom ];&#x/Typ; /P; gin; tio;&#xn 00; &#x/MCI; 0 ;&#x/MCI; 0 ; en-GB&#x/Lan;&#xg 00;&#x/Lan;&#xg 00;(III) Medium distance category In the medium distance category, intercity public transport modes compete with the automobile (i.e. KL-Penang and KLJohor Bahru). The air transport mode gets a higher mode share percentage than the automobile for intercity ridership in the Penang corridor, however air transport is often out of reach due to its relatively high service cost. Therefore, the intercity land public transport mode is an alternative. Within the intercity land public transport, rail and bus are barely competed with one another. Table 2. Demand, frequency and mode share competition in selected corridors O - D Pairs (Fro m Kuala Lumpur) R oad Dis - tance Intercity Mode Demand by Mode (Passenger/day) Intercity Mode Frequency (Departure/day) Intercity Mode Share in Selected main corridor (%) Bus a), e) Rail b) Air c) A uto Mo - bile d) Bus a), e) Rail b) Air c) A uto Mo - bile d), e) Bu s a), e) R ai l b) Air c) A uto Mo - bile d), e) Penang 369 1,218 791 3,514 4,550 42 4 32 3,500 12.1 7.9 34.9 45.2 Ipoh 205 1,815 1,578 - 5,200 55 - - 4,000 21.1 18.4 0.0 60.5 Kota Bharu 474 1,144 656 2,086 104 52 3 3 80 28.7 16.4 52.3 2.6 Kuala T ereng - ganu 455 546 - 988 78 26 - 9 60 33.9 0.0 61.3 4.8 Kuantan 259 726 - 549 3,250 33 - 5 2,500 16.0 0.0 12.1 71.8 Johor Bahru 368 3,082 777 1,098 5,850 128 3 10 4,500 28.5 7.2 10.2 54.1 Melaka 144 1,148 - - 7,150 41 - - 5,500 13.8 0.0 0.0 86.2 Alor Setar 462 552 439 769 520 24 4 7 400 24.2 19.3 33.7 22.8 Source: a) SPAD (2011), KTMB (2011), c) MAHB (2011), d) JKR (2008), ande) Primary Data Analysis (2011)4.1.2. Factor influencing intercity land public transport mode preference in selected corridors As seen in Table 3, fare and travel time attributes make the intercity bus the most popular transport mode option. Intercity land public transport traveling costs aremuch cheaper than either flight fare or automobile fuel consumption costs within each corridor. From observation of the selected corridor, intercity bus travel time is shorter than intercity train (Table 3). 4.2. Study Case AreaIn relation with the concentration of development in the National Spatial Framework 2020, intercity travel to the north, south and east of Peninsular Malaysia were categorized into eight main corridors. Referring to Jabatan Perancangan Bandar dan Desa Semenanjung Malaysia (2005), the population of Malaysia is likely to increase in several national conurbations such as Pulau Pinang and Johor Bahru (Department of Statistics, 2011). High density of population, concentration of development and the attraction of KL and its conurbations may influence the intercity movement in these origin and destination pairs. In this study, the selected corridors for intercity land transportation competition inMalaysia are possibly the north or the south corridors. The east corridors need to be Proceedings of the Eastern Asia Society for Transportation Studies, Vol.9, 2013 �� &#x/Att;¬he; [/; ott;&#xom ];&#x/Typ; /P; gin; tio;&#xn 00;&#x/Att;¬he; [/; ott;&#xom ];&#x/Typ; /P; gin; tio;&#xn 00; &#x/MCI; 0 ;&#x/MCI; 0 ;This model was uses adjusted Rto crossvalidate the model.To check the statistical significance for statistical model validations, Ttest and Ftest are used. Those tests are performed at a 5% significance level (α).4. RESULT AND DISCUSSION 4.1. Preliminary tudy In the developing world, intercity travel is dominated by bus and conventional rail travel (Ribeiro et al., 2007). Similarly, intercity travel in Malaysia is also dominated by these intercity land modes. The intercity land modes challenges will be an interesting issue to discuss and are related to fare, travel time, departure frequency and feeder mode access time competition. A field survey has been conducted in order to collect some information on selected Origin- Destination pairs for further modal competition analysis. The distance is categorized into three categories; the first is short distance (less than 300 km), the second is medium distance (301400 km), and the third is long distance (more than 401 km). Intercity bus demand is relatively higher compared to other modes for the same distance traveled(Table). Intercity bus is more flexible regarding its departure frequency compared to the train. A great number of intercity buses depart from KL to the selected corridors everyday (Table 4.1.1. General description on intercity transport mode share The intercity transport modes under investigation included bus, rail, air and automobile. According to travel distance (Table 2), this study found that the mode share pattern in Malaysia was varied. Short distance category Table 2 shows that the automobile is very dominant in the short distance category. In the corridor with less mode competitors, the automobile also gains a higher mode share, for example in KL-Melaka (automobile 86.2%, intercity bus 13.8%), in -Kuantan (automobile 71.8%, intercity bus 16.0% and air 12.1%), and in KL-Ipoh (automobile 60.5%, intercity rail 18.4% and intercity bus 21.1%). A high dependency on the automobile in the short distance corridor makes the air transport mode less favorable compared to other modes.Air transport failed to compete with the automobile (i.e., KLMelaka corridor) or rail and bus (i.e KLIpoh). Except for Kuantan, air transport is still getting a high mode share (12.1%) after the bus (16.0%), since no rail infrastructure is provided in this corridor. An interesting condition appears on the Ipoh corridor. There’s slightly less dependency on the automobile (60.5%) for this corridor compared to KLKuantan (71.8%) or KLMelaka (86.2%).Long distance category In contrast to the short distance category, public transport has a dominant mode share for the long distance category (as in the KL-Kota Bharu, KL-Alor Setar or KL-Terengganu corridors). Passenger willingness to take public transport (bus, train or air transport mode) for the longer distances usually tends to increase. This is in line with Correnti et al. (2007), who state that as the travel distance increases private cars lose their competitive advantage. When the long distance corridor is provided by an air transport service, the air transport mode becomes dominant, i.e., KL-Kota Bharu 52.3%, KL-Alor Setar 33.7% and KL-Terengganu 61.3%. Proceedings of the Eastern Asia Society for Transportation Studies, Vol.9, 2013 �� &#x/Att;¬he; [/; ott;&#xom ];&#x/Typ; /P; gin; tio;&#xn 00;&#x/Att;¬he; [/; ott;&#xom ];&#x/Typ; /P; gin; tio;&#xn 00; &#x/MCI; 0 ;&#x/MCI; 0 ;these facts, rail transport uld play a crucial role in the development of public transport facilities in Malaysia (Kumar, 2008).METHODOLOGY The data used in this research is a combination of primary and secondary data. In thispreliminary study, the secondary data was obtained from government agencies such as the Ministry of Transport (MOT), Suruhanjaya Pengangkutan Awam Darat (SPAD), Keretapi Tanah Melayu Berhad (KTMB), and Malaysia Airport Holdings Berhad (MAHB)and used in the modal competition analysis. Meanwhile, the primary data was collected through a field survey since secondary data was not available. A preliminary survey for eight origindestination pairs in Malaysia have been conducted in order to analyze the modal competition with regards the trunk mode service and access and egress mode services to the terminal. A paper based survey has been developed in order to gather information of intercity public transport user’s characteristics. For the case study area (KL Penang and KL JB), the field survey conducted in this study uses a combination of 5 minute onsite interviews and 15 minute onsite questionnaire sessions in terminals.A number of 120 intercity bus users were the respondents of this questionnairebased study for both corridors. A total of 5,880 data set of stated preference data set have been analyzed for both corridors.The questions are designed in the form of Reveal Preference (RP) questions and Stated Preference (SP) questions. The SP questions were designed in the form of two scenarios: intercity bus scenario and intercity train scenarioThe intercity bus scenario represents the changes to intercity bus service values when the intercity train values remain constant. The intercity train scenario represents the changes to intercity train service values when the intercity bus values remain constant. The intercity mode preference in both scenarios was evaluated by using the four attributes: travel time, fare, frequency and access time. Binary Logit equation and Regression analysis had been employed in SP data analysis. Remains that Bus= intercity bus utility as effect of its service value changes, Train= intercity train utility as effect of its service value changes. Thus,Bus Probability of choosing intercity bus can be written asequation (3.1): Bus . (3.1) dependent variable in the regression model was the intercity mode utility as the effect of the intercity mode service value changes. The independent variables in this modewere the mode service value differences. The mode service value which was evaluated consists of travel time, fare, frequency and access time. Therefore, equation (3.2) above can be explained as equation (3.2Y = BusTrain+ b1 BusTrain) + b2 Bus2 Train) + 3 Bus3 Train) + 4 Bus4 TrainWhereas;interceptmodel parameter= intercity mode travel time difference, and 1 = 1 Bus1 Train= intercity mode fare difference, and = XBus 2 Train= intercity mode frequency difference, and = X3 Bus3 Trainfeeder mode access time difference to intercity land public transport mode terminal, and 4 Bus4 Train Proceedings of the Eastern Asia Society for Transportation Studies, Vol.9, 2013 �� &#x/Att;¬he; [/; ott;&#xom ];&#x/Typ; /P; gin; tio;&#xn 00;&#x/Att;¬he; [/; ott;&#xom ];&#x/Typ; /P; gin; tio;&#xn 00; &#x/MCI; 0 ;&#x/MCI; 0 ;This expressway supports the intercity movement along KL Kuantan, KL Terengganu and KL Kota Bharu corridors.Rail Transportation Network inMalaysiaKumar (2008) highlights that the Malaysian Government made one of the most vital shifts in its urban transport policy by introducing rail systems in the capital city of Kuala Lumpur (KL) in the 1990’s. KTMB is a privatesector company that operates the railway network in Malaysia. It was corporatized in August 1992 (KTMB, 2012). Intercity movement via the railway network has been accommodated through three major routes (Figure 2).The first route from KL to the North (ending at Padang Besar), supports rail transport demand along the KLAlor Setar, KLPenang and KLIpoh corridors, the second route from KL to the South (ending at JB), supports the demand along the KLMelaka and KLJB corridors, while the third line from KL to the East with the final destination at Tumpat supports the demand along the KLKota Bharu corridor. Unfortunately, certain corridors such as KLMelaka, Kuala Terengganu and KLKuantan are not yet wellconnected towards these three major routes. Figure 2. Intercity train rouin Peninsular Malaysia (KTMB, 2012)After a long period of limited investment in KTMB, the intercity railway infrastructure is now being expanded and modernized (Abdul et al., 2008; Kumar, 2008). Intercity train service under KTMB management has improved its performance in many aspects, such as offering better service and faster travel time. KTMB continues with its program of refurbishing the third class coaches that ply the east coast corridor (Abdul et al., 2008). At present, the country has about 2,200km of railway tracks, with plans for more to come. KTMB operates train services such as intercity travel, suburban commuter services, freight services, container’s haulage and property storage (KTMB, 2012).Currently the KTMB intercity runs 24 intercity passenger trains daily, consisting of 16 express trains and 8 local trains (Abdul et al., 2008). In 2010, KTMB introduced the Electric Train Service (ETS), a rapid intercity service betweenKL and Ipoh, ultimately running 32 services a day. Based on Proceedings of the Eastern Asia Society for Transportation Studies, Vol.9, 2013 Figure 1.Basic road network and Main intercity transport corridor based on the development in economic region in Peninsular Malaysia (JPBD, 2005)Transportation Network in MalaysiaRoads in Malaysia are generally categorized into Federal roads, State roads, Municipality roads and toll roads (privatized roads). These categories are based on ownership and administration of the road concerned. The total road length in 2010 is 157,000 km of which 12% are Federal Roads and 75% are State roads and Municipality roads. Toll roads are mainly interurbanexpressways and urban expressways and this amount to around 1,820 km.The basic road network in Peninsular Malaysia is illustrated in Figure 1.JPBD (2005) notethat the ninth Malaysia Plan (9MP) for the period 2006marked the expansion of infrastructure development with an effort to increase the efficiency of existing facilities and improve the accessibility and linkages in rural areas. All major economic centers are linked to one another and have good connection to the ports with relatively good road networks (Abdul et al., 2008). Malaysia road transportation accounts for 96% of total passenger and goods transport in the country. Intercity movement via the road network along the corridors of KLIpoh, KLAlor Setar, Penang, KLand KLMelaka are accommodated by the existing NorthSouth Expressway (NSE). According to Projek Lebuhraya UtaraSelatan Berhad [PLUS] (2011a), the NSE is the longest expressway in Malaysia, with the total length of 772 kilometers spanning from Kedah(near the MalaysiThai border) to (at the southern tip of Peninsular Malaysia). Besides the NSE, intercity movement along the five corridors mentioned is also accommodated by others 3 expressways which adjoin each other, with a total of 847.7 km of interurban toll highways, used to support traffic movement in Malaysia. In addition, theButterworthKulim Expressway (BKE) supports a connection of theeast Kedahand ) with the west (Penangand Butterworth). BKE is also a main route to Federal route (West Highway) toward PerakGrikKedand BalingPLUS, 2011b). IPOH TERENGGANU PENANG ALOR S E TAR KL KOTA BHARU MELAKA JOHOR BAHRU KUANTAN 1 8 3 2 4 5 6 7 KL Proceedings of the Eastern Asia Society for Transportation Studies, Vol.9, 2013 �� &#x/Att;¬he; [/; ott;&#xom ];&#x/Typ; /P; gin; tio;&#xn 00;&#x/Att;¬he; [/; ott;&#xom ];&#x/Typ; /P; gin; tio;&#xn 00; &#x/MCI; 0 ;&#x/MCI; 0 ;relies on buses and trains for intercity land public transport movement. Train is preferred because of good accessibility to the terminal, even though less comfort than the bus. Sometimes the travel time becomes longer in certain routes, since the conventional train is still single track, lower speed and the rail network coverage is limited. Bus services are available in all cities in Peninsular Malaysia. The fare is also affordable for long journeys. It offers more comfort and shorter travel time than the train. But accessibility to the terminal is sometimes poor since the bus terminal is usually located around the border of the city. Intercity bus is still the preferred mode. The wider route coverage of intercity bus, higher departure frequency, lower fare, shorter travel time are among the factors to choose an intercity bus rather than train in Malaysia.These two types of land public transport modes constantly compete against each other, so bus and rail will be considered in this further study of intercity land public transport.Table 1 shows a brief review of intercity land public transport mode characteristics in Malaysia.Table 1. Intercity land public transport mode characteristics in Peninsular Malaysia Transport Mode The Characteristic of Transport Mode Intercity Bus Intercity bus service is available in almost all of the cities in Peninsular Malaysia, unlike rail which has s limited track service, especially i n the east corridors of Peninsular Malaysia. The wider route coverage is among the reasons why intercity bus has become more popular than intercity train. Intercity Train In Malaysia, the shortage of resources for locomotives and crews, the low average t rain speeds (60 kph), narrow 1 meter track gauge and old rolling stock have become the constraints in rail transport (Abdul et al ., 2008). These constraints have resulted in longer travel times on certain routes. In addition, the restricted market coverage for the Keretapi Tanah Melayu Berhad (KTMB) network has also become a contributory obstacle in railway transport in comparison to the road network ( Kumar, 2008 ) . Therefore the bus is getting a high modal share since it is quick and comfortable. Train in Malaysia is preferred because of its good accessibility t o the train station. Train also has advantages over the road transport industries in terms of the socio - economic benefits such as the number of road accidents and pollution (Abdul et al ., 2008). In terms of service, Malaysia’s intercity train KTMB offers a more comfortable berth than the bus seat, but requires a higher price. However, at the same class level of service, the train is the less comfortable (seat) than the bus. 2. CURRENT SITUATION OF INTERCITY LAND MODE TRANSPORT SERVICE IN MALAYSIA National Spatial Framework 2020 explains that future urban growth centers will be concentrated in strategic conurbations (JPBD, 2010).The concentration of development in conurbations means that urbanbased economic activities will be concentrated in the main nurbations of Kuantan, Penang/ George Town, Johor Bahru (JB) and Kuala Lumpur (KL) to promote efficiency in land use and infrastructure planning which is globally competitive.The concentration of development and the attraction of KL and its conurbations may influence the intercity movement in these origin and destination pairs.In relation with the concentration of development in the National Spatial Framework , intercity travel to the north, south and east of Peninsular Malaysia were categorized into eight main corridors. The eight main intercity corridors are namely; KL Alor Setar, KL Penang, KL Ipoh, KL JB, KL Melaka, KL Kuantan, KL Kota Bharu and KL Kuala Terengganu (Figure Proceedings of the Eastern Asia Society for Transportation Studies, Vol.9, 2013 Intercity Land Public Transport Challenges in Developing Country: A Case Study in Peninsular Malaysia Angelalia ROZASuhana KOTINGMohamed Rehan KARIM a,b,cCenter for Transportation Research, Faculty of Engineering, University of Malayauala Lumpur, Malaysiaangelaliaroza@gmail.commail: suhana_koting@um.edu.mymail: rehan@um.edu.my AbstractThis research aims to determine the influencing factors for transport mode preferences which lead to existing competition among intercity land public transport modes in developing country such s MalaysiaIn Malaysia, the intercity bus is preferred to the train, but now it is confronting increasing challenges. It is crucial that an answer be found to this problem as intercity bus transport plays an important role in the intercity transportation systemin this country. A total of 5,880 data set was analyzed using Stated referencetechnique and binary logit equation.It is really interesting finding that bus users have a different perception on the value service changes of their current mode toward their mode’s competitor. This study considers providing a better understanding of higher intercity bus ridership against the train in Malaysia based on the determined explanatory attributes Keywords: Intercity Bus, Intercity Travel Characteristics, Stated Preference, Binomial Logit, Sensitivity. 1.INTRODUCTION The intercity mobility in Malaysia is widely served by intercity land transport services (automobile, intercity bus and train) and an intercity air transport service. Each mode has specific characteristics that influence its preference. Air travel is much faster compared to road travel, which people claim as slow and tedious. The air transport service in Malaysia offers a frequent flight departure/day, high safety level and extremely comfortable journey for users. Travelling by airplane takes the shortest time to reach the destination compared to other alternatives. But similar to other developing country, the poor accessibility to the airport (requires transit), higher feeder transport cost, and longer waiting and access times have become the obstacles in air transport (Correnti et al., 2007). Air travel requires considerable travel time, including the movement from the city to airport, processing and waiting times (Correnti et al., 2007). In addition, air transport only becomes worthwhile for the passengers when the travel time is at least several times longer than the nontravel time. This becomes obvious when the distance between departure and destination point is sufficiently far apart. Travel time difference between road travel and air travel will be very wide. When the travel distance is over 300 km, air transportation possesses irreplaceable advantages over the other modes (Correnti et al., 2007). In Malaysia, the automobile generally forms the largest mode share in intercity travel modes, followed by intercity bus and intercity train. The car itself is the second (40%) most ommon mode for transportation in Malaysia (Nurdden et al., 2007). Despite this, Malaysia Proceedings of the Eastern Asia Society for Transportation Studies, Vol.9, 2013