/
OverviewSkyrocketing college tuitions and trillion-dollar student loan OverviewSkyrocketing college tuitions and trillion-dollar student loan

OverviewSkyrocketing college tuitions and trillion-dollar student loan - PDF document

luanne-stotts
luanne-stotts . @luanne-stotts
Follow
450 views
Uploaded On 2016-01-15

OverviewSkyrocketing college tuitions and trillion-dollar student loan - PPT Presentation

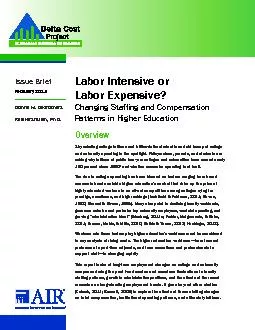
February 2014Donna M DesrochersRita Kirshstein PhD Patterns in Higher Education The overarching trends show that between 2000 and 2012 the public and private nonprot higher education workforce g ID: 222252

February 2014Donna DesrochersRita Kirshstein

Share:

Link:

Embed:

Download Presentation from below link

Download Pdf The PPT/PDF document "OverviewSkyrocketing college tuitions an..." is the property of its rightful owner. Permission is granted to download and print the materials on this web site for personal, non-commercial use only, and to display it on your personal computer provided you do not modify the materials and that you retain all copyright notices contained in the materials. By downloading content from our website, you accept the terms of this agreement.


Presentation Transcript

OverviewSkyrocketing college tuitions and trillion-dollar student loan debt have put college and university spending in the spotlight. Policymakers, parents, and students are asking why tuitions at public four-year colleges and universities have soared nearly The rise in college spending has been blamed on factors ranging from broad economic trends outside higher education’s control that drive up the price of highly educated workers to an all-out competition among colleges vying for prestige, excellence, and high rankings (Archibald & Feldman, 2011; Bowen, 1980; Baumol & Bowen, 1966). Many also point to declining faculty workloads, generous salaries and perks for top university employees, wasteful spending, and growing “administrative bloat” (Ginsburg, 2011a; Vedder, Matgouranis, & Robe, 2011; Greene, Kisida, & Mills, 2010; Belkin & Thurm, 2012; Hechinger, 2012).Whatever role these factors play, higher education’s workforce must be considered in any analysis of rising costs. The higher education workforce—from tenured professors to part-time adjuncts, and from executives and professionals to support staff—is changing rapidly.This report looks at long-term employment changes on college and university campuses during the past two decades and examines uctuations in faculty stafng patterns, growth in administrative positions, and the effects of the recent recession on long-standing employment trends. It goes beyond other studies (Zaback, 2011; Bennett, 2009) to explore the effects of these stafng changes on total compensation, institutional spending patterns, and ultimately tuitions. February 2014Donna M. DesrochersRita Kirshstein, Ph.D. Patterns in Higher Education The overarching trends show that between 2000 and 2012, the public and private nonprot higher education workforce grew by 28 percent, more than 50 percent faster than the previous decade. But the proportion of staff to students at public institutions grew slower in the 2000s than in the 1990s because the recent expansion in new positions largely mirrored rising enrollments as the Millennial Generation entered college. By 2012, public research universities and community colleges employed 16 fewerstudents compared with 2000, while the number of staff per student at public master’s and bachelor’s colleges remained unchanged. The data in this report come from the Delta Cost Project Database, 1987–2010. It includes data reported by institutions to the U.S. Department of Education’s Integrated Postsecondary Education Data System (IPEDS), and has been harmonized (when possible) to account for survey changes over time. Stafng and faculty salary data from the 2011 Fall Staff Survey (e.g., 2011–12 school year, or 2012 academic year) were appended onto the Delta Cost Project Database to show the most current stafng data available. All spending data are shown in 2010 dollars and were adjusted using the Consumer Price Index for All Urban Consumers (CPI-U), on a scal-year basis.The report focuses primarily on the 12-year period from 2000 to 2012, although it also extends back to 1990 on many measures to provide additional context. Data on stafng and labor costs may be shown for different periods depending on data availability and reliability. Findings are presented for public and private, nonprot four-year institutions and public community colleges, organized by 2005 Carnegie Classication. Institutions may award many types of degrees and certicates, although the Carnegie Classication denotes the highest type of degree typically offered as follows:Research institutions: Award at least 20 research doctoral degrees a year.Master’s institutions: Award at least 50 master’s degrees and fewer than 20 doctoral degrees per year.Bachelor’s institutions: Bachelor’s degrees undergraduate degrees; fewer than 50 master’s or 20 doctoral degrees are awarded per year.Public community colleges: Award associate’s degrees or certicates requiring two or fewer years of study; bachelor’s degrees account for less than 10 percent of degrees per year. Source: Carnegie Foundation for the Advancement of Teaching, 2013. At private colleges, in the wake of accelerated hiring, the proportion of staff to students rose. Private institutions employed, on average, 15 to 26 additional workers per 1,000 FTE students between 2000 and 2012. And even during the Great Recession, many public and private colleges kept hiring in response to the uptick in new students. Other Key FindingsGrowth in administrative jobs was widespread across higher education—but creating new professional positions, rather than executive and managerial positions, is what drove the increase. Professional positions (for example, business analysts, human resources staff, and admissions staff) grew twice as fast as executive and managerial positions at public nonresearch institutions between 2000 and 2012, and outpaced enrollment growth. Colleges and universities have invested in professional jobs that provide noninstructional services, not just business support. educational sectors, wage and salary expenditures for student services (per FTE staff) were the fastest growing salary expense in many types of institutions between 2002 and 2012. Part-time faculty/graduate assistants typically account for at least half of the instructional staff in most higher education sectors. have continued to hire full-time faculty, but at a pace that either equaled or lagged behind student enrollments; these new hires also were likely to Part-time faculty (and graduate assistants) provided additional capacity at well-funded research universities and private colleges, but replaced new, full-time positions at broadly accessible, public master’s and bachelor’s institutions. As the ranks of managerial and professional administrative workers grew, the number of faculty and staff per administrator continued to The average number of faculty and staff per administrator declined by roughly 40 percent in most types of four-year colleges and universities between 1990 and 2012, and now averages 2.5 or fewer faculty and staff per administrator. Faculty salaries were not the leading cause of rising college tuitions during the past decade. Increased benets costs, nonfaculty positions added elsewhere on campus, declines in state and institutional subsidies, and other factors all played a role. The average salary outlay per full-time faculty member has stayed essentially at from 2002 to 2010. But additional savings from shifting to part-time instructors have not been enough to offset the costs associated with continued hiring and rising benets expenditures. Compensation costs per FTE student have continued to rise modestly at most four-year institutions as a consequence of these stafng, salary, and benets changes. Tuition prices increased even faster, however, as tuition dollars replaced revenue lost from other sources. Where’s the Job Growth in As the rest of the economy plunged into the Great Recession of 2008, higher education continued to hire new workers amid a surge of new students enrolling in college. But the hiring surge began nearly a decade before, when schools Total EmploymentTotal employment rose by more than 25 percent between 2000 and 2012, expanding faster than the previous decade (16 percent). But student enrollment also increased as the Millennials entered college. For most of this period, the combination of rising enrollments and two economic recessions blunted any signicant increase in the ratio of employees to students at public institutions, but did not deter growth at private institutions. Public institutions already experienced an earlier surge in the 1990s, when the number of staff expanded relative to the number of students (see Appendix Table 1). Unlike many other sectors of the economy hit hard by the 2008 recession, higher education continued to add new workers. As the recession took hold, rising student enrollments—rather than a slowdown in hiring—led to the rst declines in the number of employees per FTE students at public institutions since 2008. By 2012, public research universities and community colleges had 16 fewer workers for every 1,000 FTE students (a decline of 5 to 9 percent), while the number of staff per FTE student at public master’s and bachelor’s colleges remained unchanged compared with 2000 (see Figure 1). Hiring at colleges and universities increased decade, but so did enrollments. As public balance hiring against rising enrollments, private institutions added new employees Public master’sPublic bachelor’sPrivate master’sPrivate bachelor’s Private colleges avoided similar declines during the 2008 recession. By 2012, they had added 15 to 26 more workers per 1,000 FTE students compared with 2000 (growing 5 to 12 percent). Many of these new private-sector hires lled part-time positions. But even after adjusting for these differences, the number of private-college employees per student still increased 3 to 5 percent, while the number of public-college employees per student declined by 3 to 12 percent (see Appendix Table 1). Public institutions have traditionally displayed the leanest staff-to-student ratios in higher education. Research institutions (both public and private) consistently show higher relative stafng levels, which reects the additional staff needed to run and support their research missions. Private institutions average higher stafng ratios, in part, because they tend to have more resources. Economy of scale also is a factor; in smaller private institutions, xed administrative and overhead costs must be spread across a smaller student population. Source: Delta Cost Project IPEDS Database, 1987–2010, 24-year matched set; IPEDS Fall Staff Survey, 2011.Figure 1Private institutions have added employees faster than students, while public institutions have struggled to keep paceAverage headcount employees per 1,000 FTE students, FY 2000 and FY 2012 Delta Cost Project| 6 The faculty and stafng categories used in this report follow the federal IPEDS reporting categories and denitions.Instructional staffStaff whose primary responsibility is instruction, research, public service, or a combination of these roles. Faculty may hold the rank of professor, associate professor, assistant professor, instructor, lecturer, or equivalent; faculty may be on tenure track, not on tenure track, or “without faculty status.”Part-time faculty: Staff whose primary responsibility is instruction, research, public service, or a combination of these roles; part-time designation is determined by the institution.Graduate assistants/instructors: Students employed part time to assist with classroom or laboratory instruction, or to Administrative staffExecutive, administrative, and managerial (EAM): Positions where work is directly related to management policies or general business operations of the university. Examples include presidents, vice presidents, managers, provosts, and deans. Assistant and associate positions (e.g., assistant deans, associate department heads) also are included if their principal activity is administration, not instruction. (Deans and department heads whose principal activity is instruction, research, or public service are classied as faculty/instructors.)Professional (support and service): Positions that provide student services, academic, or professional support and generally require a bachelor’s degree. analysts, human resources staff, computer administrators, counselors, lawyers, librarians, athletic staff, and health workers.Nonprofessional support staffTechnical and paraprofessional: Positions that require specialized knowledge but provide support to professional staff. Examples include math, science, and health technicians, and paralegals. include secretaries, administrative assistants, and ofce clerks.Skilled crafts: Positions that require specialized manual skills, such as plant Service and maintenance: include police ofcers, food service workers, building and grounds employees, and maintenance workers.Source: National Center for Education Statistics, 2011. Managerial and Professional JobsThe explosion of new workers attending to the noninstructional side of higher education has not gone unnoticed on college and university campuses. Although the most visible positions—such as newly hired executives, managers, and administrators—tend to draw the greatest attention, most hiring has occurred within the administrative ofces they often oversee. Professional employees—such as business analysts, human resources staff, admissions staff, computer administrators, counselors, athletic staff, and health workers—are the largest group of noninstructional staff on campus. These positions typically either support the business functions of colleges and universities or provide noninstructional services to students.Professional positions increased, on average, by 2.5 to 5 percent per year between 2000 and 2012. Executive and managerial positions grew by 2.5 percent or less in public institutions; growth was faster in the private sector but still lower than for professional positions. Across most types of four-year institutions, the number of new professional jobs was second only to the number of new part-time faculty positions added during the previous decade (see Appendix Table 2). Professional workers now account for approximately 20 to 25 percent of on-campus jobs, increasing by 2 to 5 percentage points between 2000 and 2012 (except at private research institutions where increases were smaller; see Figure 2). At research institutions, professional staff even outnumbered full-time faculty. The number of professional positions has increased much faster than student enrollment—adding, on average, between 5 and 10 new positions per 1,000 FTE students at most types of four-year institutions since 2000 (outpaced only by the increase in part-time instructors; see Appendix Table 3). This represents a 10 to 18 percent increase, except at public master’s and bachelor’s colleges where the increase was at least double. Executive-level positions represent a small share of jobs on campus, between 4 and 6 percent at public institutions in 2012, changing little in more than a decade (see Figure 2). Private institutions have a more substantial investment in these types of positions, but when accounting for changes in enrollments over time, only private research universities showed signicant expansion. In all other sectors, executive hiring has largely kept pace with student enrollment growth since 2000 (see Figure 3 and Appendix Table 3). “Administrative bloat” is a rising concern across higher education, stafng has grown growth stems largely from an increase in professional support level executives and administrators. Delta Cost Project| 8 Public master’sPublic bachelor’sPrivate master’sPrivate bachelor’sSource: Delta Cost Project IPEDS Database, 1987–2010, 11-year matched set; IPEDS Fall Staff Survey, 2011. Figure 2All types of colleges and universities have added professional staff while increasing reliance on part-time faculty/instructorsDistribution of headcount employees by type of job, FY 2000 and FY 2012 Part-time facultyPart-time instructors/graduate assistantsExecutive, administrative, and managerialNonprofessional (technical, clerical, skilled craft, and service/maintenance) Faculty JobsOn most college campuses, the majority of workers are not teaching students. Less than half of employees at four-year, nonresearch institutions are faculty (full- or part-time), and at research institutions faculty account for only 25 to 30 percent of all jobs (see Figure 2). Although there are more faculty members on campus, most of the increase is from the growing use of part-time faculty. With the exception of research universities, the proportion of all employees who were community colleges between 2000 and 2012. Colleges and universities have continued to hire new full-time faculty members, but largely to accommodate the natural growth in student enrollment. The ratio of full-time faculty to students was steady or slightly declining in most sectors between 2000 and 2012 (see Figure 4). Only private research universities, on average, made signicant investments in full-time faculty. They added 16 full-time faculty per 1,000 FTE students from 2000 to 2012 (a 19 percent increase), But the number of contingent faculty members is growing—even among professors From 2004 to 2012, the number of full-time professors Figure 3New full-time faculty and executive positions primarily accommodated growing enrollments; only private research universities expanded these positionsHeadcount employees per 1,000 FTE students, FY 1990–FY 2012 Source: Delta Cost Project IPEDS Database, 1987–2010, 24-year matched set; IPEDS Fall Staff Survey, 2011. Public research universities Private research universities Part-time faculty/instructors/graduate assistantsExecutive, administrative, and managerialNonprofessional (technical, clerical, skilled craft, and service/maintenance) 1146253 14163777256308373691111410241 on short-term contracts increased by 30 to 50 percent. Nevertheless, the share of full-time contract faculty increased less than 1 percentage point in a decade, although shifts were larger at master’s and bachelor’s institutions (American Federation of Teachers, 2009; Curtis & Thornton, 2013). Colleges and universities have continued to rely on part-time faculty to meet instructional demands while reining in costs; these part-time positions are among the fastest growing on campus. Unlike other institutions, research universities depend heavily on their graduate assistants to provide part-time instruction; public research institutions, in particular, now employ as many graduate assistants as full-time professors.master’sbachelor’smaster’sbachelor’s 2520155-5-100124-4103-262-8-7-2162170207-1103 Figure 4Part-time faculty have added instructional capacity in some sectors while substituting for full-time faculty in other sectorsChange in average number of full- and part-time faculty per 1,000 FTE students, Source: Delta Cost Project IPEDS Database 1987–2010, 11-year matched set; IPEDS Fall Staff Survey, 2011. Part-time faculty/instructors/graduate assistantsFull-time equivalent of part-time faculty/instructors/graduate assistants Since 2000, four-year institutions averaged about 10 to 20 additional part-time faculty/instructors per 1,000 FTE students (see Figure 4). This represents a 15 to 25 percent increase at most types of four-year institutions, except master’s colleges where growth was 35 percent. Private master’s institutions have made some of their biggest investments in part-time faculty, who have become their largest group of employees, representing 30 percent of all campus workers in 2012. Only community colleges had declines in the number of both full- and part-time faculty per FTE student between 2000 and 2012. But the number of professional positions per student continued to rise during this time, and declines in the proportion of nonprofessional jobs were smaller than at four-year institutions; community colleges Although part-time professors are less expensive, concerns remain about whether they offer the same quality instruction as full-time professors or whether they adversely affect student outcomes. There is some evidence that increased reliance on part-time faculty can reduce graduation rates and persistence to the second year, particularly at comprehensive institutions (Ehrenberg & Zhang, 2005). But other research has shown that adjuncts have a positive or indifferent impact on their students’ subsequent interest in those elds (Bettinger & Long, 2010; Figlio, Schapiro, & Soter, 2013).As the number of part-time instructors grows, job security continues to erode among full-time faculty. Academics today are less likely than a decade ago to have tenure, hold a tenure-track position, or be full professors. Although tenure systems are a mainstay at research universities and public master’s institutions, they have become less prevalent at other public and private institutions. The proportion of tenured faculty has declined across the board, even in sectors with nearly universal access to tenure systems. In 2012, less than half of full-time instructional staff at public and private four-year institutions held tenure, a decline of 4 to 5 percentage points since 2000 (National Center for Education Statistics, 2013a). And among full-time faculty, the share of “professors” declined by more than 4 percentage points since 2003, as adjuncts and other contingent faculty were increasingly at the lectern (National Center for Education Statistics, 2007, 2013b). Nonprofessional JobsAs in the broader economy, the middle-skilled jobs—those providing clerical, technical, skilled craft, and service/maintenance services—represented a smaller share (about one quarter) of jobs on campus in 2012 compared with 30 to 35 percent of campus jobs more than a decade earlier. Middle-skilled jobs continue to represent the largest group of workers on most types of campuses—exceeding the number of workers in professional or full-number of workers in these jobs remained fairly Relying on part-time savings measure largest change in employment landscape. Although the full-time, tenure-endures, contingent workers have increasingly inltrated steady during the decade, but they comprised a smaller share of jobs because of job creation elsewhere on campus.As both total employment and student enrollment grow, these workers are serving greater numbers of staff and students. As in other sectors of the economy, technology has led productivity improvements in many of these types of jobs. Balancing Hiring Between Faculty and AdministratorsAmid the signicant shifts in campus employment, there is tension in balancing new administrative and academic positions. And although the use of adjunct faculty is often unpopular, growing reliance on part-time faculty is more prevalent in certain types of institutions.Full- Versus Part-Time Faculty JobsPublic master’s and bachelor’s colleges, as well as community colleges that collectively serve large numbers of students at low cost, are most vulnerable to making part-time faculty substitutions. Public master’s and bachelor’s colleges lost between two and four full-time faculty per 1,000 FTE students from 2000 to 2012, mirroring the increase in “full-time equivalent” part-time faculty (relative to student enrollment; see Figure 4). This suggests that part-time instead of full-time faculty were hired to accommodate growing enrollments. But among their private-sector counterparts, part-time faculty have provided additional capacity rather than serving as full-time faculty replacements; these institutions added three to seven “full-time equivalent” part-time faculty per 1,000 FTE students. Public and private research institutions also have relied heavily on part-time faculty and graduate assistants to expand their teaching capacity, although the private research institutions also have invested heavily in new full-time faculty. In those sectors adding capacity, it is unclear how these changes have affected faculty course loads. Expansion may have allowed colleges and universities to add new courses or course sections, decrease the course load of existing part-time instructors, or ofoad full-time faculty course loads onto part-timers. What is clear, however, is that community colleges have fared worse than four-year institutions in faculty hiring. In 2012, as their enrollments surged because of the recession, community colleges employed fewer full- part-time faculty per FTE student compared with more than a decade earlier. At the same time, the proportion of full-time community college faculty dropped sharply as the schools increasingly employed more—but not necessarily enough—part-time instructors.skilled jobs is largely unchanged, but they now represent a smaller share of campus employment and serve larger numbers of staff workers continue to New part-time faculty replaced additional sectors with the fewest resources and sectors, however, part-time faculty have capacity. executive and professional staffexecutive and professional staff Public research 19901.320001.02012 0.9 Public master’s 2.0 2000 1.5 2012 1.1 Public bachelor’s 1.9 2000 1.4 2012 1.1 Public community colleges1990 2.2 2000 2.1 2012 1.5 Private research1990 1.1 2000 0.9 2012 0.7 Private master’s 1.3 2000 1.0 2012 0.8 Private bachelor’s 1.3 2000 1.0 2012 0.8 020234 Faculty Versus Administrator JobsGrowing numbers of administrative positions (executive and professional) and changes in faculty composition represent long-standing trends. The shifting balance among these positions has played out steadily over time in favor of administrators, and it is unclear when a tipping point may be near. Whether this administrative growth constitutes unnecessary “bloat” or is justied as part of the complexities involved in running a modern-day university remains up for debate. Back in 1990, all types of public and private colleges and universities averaged more full-time faculty positions than administrative positions (see Figure 5a). Public nonresearch institutions in 1990 averaged roughly twice as many full-time faculty as administrators—more than 20 years later, the two were almost equal. Source: Delta Cost Project IPEDS Database, 1987–2010, 24-year matched set; IPEDS Fall Staff Survey, 2011.Figure 5a Public master’sPublic bachelor’sPrivate master’sPrivate bachelor’s By 2012, the pendulum had swung at private nonprot colleges and public universities, which averaged less than one full-time faculty member (.75 to .90) for every administrator. However, the rapid growth in part-time faculty during the past two decades has expanded the total number of “full-time equivalent” faculty. The pendulum has swung back, showing there were between 1 and 1.5 full-time equivalent faculty members per administrator at public four-year institutions. A comprehensive look at all campus employment also shows the familiar shift toward administrative positions (see Figure 5b). There were at least three times as many FTE faculty and staff for every administrative position in 1990. By 2012, this gure had declined by roughly 40 percent, to an average of 2.2 to 2.5 faculty and staff per administrator at public institutions, and two or fewer faculty and Source: Delta Cost Project IPEDS Database, 1987–2010, 24-year matched set; IPEDS Fall Staff Survey, 2011.Figure 5bNumber of FTE faculty and staff per FTE executive and professional staff A number of explanations have been advanced for the growth in campus administrators. Chief among them is the rise in government mandates, followed by oversight of more complex administrative requirements (e.g., information technology, enhanced student services), redened faculty and administrator responsibilities, reliance on fundraising revenues and the staff to generate them, and simply expanding bureaucratic efdoms (Leslie & Rhoades, 1995; Greene et al., 2010; Archibald & Feldman, 2008; Ginsburg, 2011b; Martin & Carter Hill, 2013). Regardless of the reason—whether justied or not—college administrators have assumed a much larger presence on college campuses than ever before.Spending on employee compensation—salaries and benets—is a major component of higher education costs. Although higher education’s primary mission is teaching, faculty compensation represents only about one half of total compensation costs. Full-time faculty salaries have grown little in recent years, making them an unlikely culprit behind rising higher education costs. Other personnel costs, including employee benets and compensation for staff providing noninstructional services, have grown faster. Although reliance on adjunct faculty has held down instructional costs, it has not been enough to offset these other costs. Total CompensationColleges and universities devote an average of 60 to 70 percent of their total spending (excluding auxiliaries, hospitals, and other independent operations)to employee compensation; instructional faculty and staff account for about half of the proportion institutions, with noticeable increases only in the private master’s and bachelor’s colleges. Although changes in data collection prevent direct comparisons with earlier years, trends in the 1990s show that the compensation share and instructional share of compensation both declined as a share of total spending during this time. Although this appears at odds with the overall stafng trends (which showed growth across both decades, accelerating during the 2000s), a shift in the composition of jobs appears to have saved money during the 1990s, but the uptick in hiring during the 2000s eventually offset any cost savings.The growth in excess “bloat”—is not a recent occurrence, but represents a continuing trend toward jobs that services or noninstructional student services. Despite increased spending by colleges and universities, generally have not consumed a larger share of institutional budgets. Faculty SalariesDespite public perceptions, there is little evidence that faculty salaries are the leading cause of rising spending or tuition costs in higher education. Education and —the core measure of spending on academics (which includes instruction, student services, and a portion of overhead expenses)—increased at an ination-adjusted, annual rate of roughly 1 percent or less per year at public four-year institutions during much of the past decade (see Figure 6). But various measures of spending on instruction show much slower growth: Average salary expenditures for full-time faculty increased a mere 0.2 percent per year since 2002 at public research institutions and were essentially at elsewhere in the public sector. Instructional salary outlays per FTE faculty member (and per FTE student) generally declined. Although average full-time salary outlays grew slightly faster at private nonprot institutions, they grew slower than overall E&R spending.Other salary surveys also have shown that the salaries of full-time faculty were essentially at during the last decade after adjusting for ination (Clery, 2013; Curtis & Thornton, 2013). But there are critical distinctions within the full-time faculty ranks, and not all have fared equally well. Established professors earned higher salaries—averaging $60,000 to $100,000 in 2012 depending on rank—and enjoyed larger salary increases than other faculty members during the past decade (Clery, 2013; College and University Professional Association for Human Resources, 2013a). The growing number of full-time—but non-tenure-track—faculty earned signicantly less ($47,500, on average) than established professors and have not enjoyed the same salary increases over time (Curtis & Thornton, 2013; Clery, 2013). Most salary savings come from adjunct faculty who earn, on average, $2,700 per course, which for a full eight-course load over a year would pay just more than $21,000, without benets.Looking beyond faculty salaries, prior analyses by the Delta Cost Project have shown that tuition prices grew much faster than E&R spending (and faculty salaries) because of declining revenues, particularly state appropriations in the public sector.Institutions have increasingly relied on tuition dollars to offset declining institutional and pay for modest spending increases; students now cover a much larger share of their educational costs than ever before. Faculty salaries are rather, cost-shifting noninstructional services have led to the increases. Data show change in ination-adjusted dollars.Source: Delta Cost Project IEPDS Database, 1987–2010, 11-year matched set; IPEDS Fall Staff and Salary Survey, Figure 6Average annual percent change across various spending measures, FY 2002–FY 2010 Tuition pricesInstruction salaries per FTE facultyInstruction salaries per FTE student Delta Cost Project| 17 master’sbachelor’scollegesPrivate Private master’sPrivate bachelor’s Wage and Salary Expenses Within The many new professional positions that colleges and universities have added in recent decades provide support across a variety of university functions, including noninstructional academic support, general institutional support, and student services unrelated to instruction. The limits of federal data collection prevent direct mapping between staff and spending categories, but trends in wage and salary expenditures during this time suggest that many new hires may be providing student-related services rather than just broad institutional support—particularly in private, nonresearch institutions. Because student services is a broad category that includes a variety of activities—from recruitment, admissions, nancial aid, and registrars, to student counseling, student organizations, and athletics—it is difcult to precisely determine the types of services that student support workers provide. But many student-related activities (ranging from course and career guidance to disciplinary actions) that were previously under the purview of faculty have been centralized, to free up faculty time and standardize the types and quality of services provided. Investments that directly support student success are wise if they lead to improved learning and degree outcomes. Surveys that collect more detailed data on professional staff salaries show that these jobs typically pay less than full-time faculty positions (which reect nine-month contracts). Median salaries for professional workers generally ranged between $55,000 and $60,000 in scal year 2013 and were quite similar across expenditure categories. New student services positions typically pay around $55,000—less than full-time professor positions, but signicantly more than adjunct faculty appointments (College and University Professional Association for Human Resources, 2013b).Wage and salary expenditures for student services (standardized by FTE employment) increased faster than average wages and salaries across all types of institutions (see Figure 7 and Appendix Table 4). Although student service expenditures are not large compared with other expenditure categories, the increase is notable for its consistency and because salary expenditures per FTE staff in most other spending categories (including institutional and academic support where many other managerial and professional positions are located) grew slower than average at public master’s and bachelor’s colleges. Public research institutions, however, showed widespread increases across categories, Growing personnel expenditures services suggest “administrative bloat” reects widespread midlevel professionals noninstructional some sectors, including research universities, also have increased spending support staff. Wage and salary expenditure categories were normalized using total FTE staff (excluding research assistants) because stafng data for each individual category are unavailable. Growth rates reect the average annual Source: Delta Cost Project IPEDS Database, 1987–2010; 11-year matched set. master’sbachelor’scollegesPrivate Private master’sPrivate bachelor’sFigure 7Wage and salary expenditures for student services have grown faster than other spending categories Change in wage and salary expenditures per FTE staff relative to average growth, Change in total expenditures per FTE student relative to average growth, InstructionStudent servicesInstitutional supportAcademic supportBelow Average GrowthAbove Average GrowthBelow Average GrowthAbove Average GrowthPercentage Point Difference From Average Growth Rate suggesting that their new professional staffs may have been broadly deployed. Only public and private research institutions and private bachelor’s institutions showed larger new dollar investments in institutional support than in student services.The relative growth in student services is not to downplay the role of other campus support functions in institutional cost increases. In previous Delta Cost Project reports, analyses that capture spending showed above-average spending across campus support functions (student services, institutional and academic support; see Figure 8). This broader analyses captured not only wages and salaries, but also rising benets costs and other noncompensation spending (e.g., computer and ofce equipment/supplies, library acquisitions, travel expenses), which together contributed to spending increases in each category.Salaries, Benets, and CompensationAs in other industries, benets costs—including medical and dental plans, retirement contributions, Social Security and unemployment insurance taxes, life and disability insurance plans, and tuition and housing benets—are rising rapidly across all sectors of higher education. Benets paid to full-time faculty accounted for 21 to 23 percent of total compensation in 2010, rising more than 2 percentage ; average benets expenditures grew by more than 2 percent per year in most sectors, contributing to this increase (see Figure 8). However, there is conicting evidence on whether benets costs are rising at similarly rapid rates at public and private institutions. Measures of overall benets expenditures for colleges and universities show that the benets share of costs is higher at public institutions (23 to 24 percent versus 20 percent at private institutions) and also is growing much faster. But, by any measure, benets costs are growing across all institutions and account for a rising share of compensation costs. Although public-sector college and university benets packages are typically more generous than those in the private sector, public institutions are less free to manage these costs, which are treated as “xed” costs within the state budget and often are set by the state, not the institutions. Universities have managed to control some of their benets costs by relying on part-time faculty positions, which usually do not come with benets. Although this improves the nancial picture for universities, it is at the expense of workers.costs remain a concern across all types of colleges and universities, and have emerged as the primary driver of increased Total Compensation Costs per Employee Total compensation costs per employee have continued to rise in public institutions, as increasing benets expenses have offset savings gained by holding salary costs down (see Figure 8). Private institutions, however, have further limited growth in total compensation per employee with smaller benet-cost increases and stafng shifts to keep increases in overall salary expenditures per employee low. Employee compensation costs have increased across most four-year sectors, with declines at community colleges. Although private institutions had per employee, compensation costs grew somewhat faster per FTE student as hiring outpaced student enrollment increases. At public four-year institutions, compensation increased both on a per-employee and per-student basis, although stafng shifts and increases in student enrollments softened the per-student cost increases. Despite efforts to control staff costs, if the volume and/or cost of new hires outpace(s) student enrollments, employee compensation costs per student will continue to rise. Reliance on part-time spending, but rising new hiring elsewhere on campus have offset education institutions. Faculty Faculty Salary Outlay EmployeeBenet Outlay EmployeeCompensation per FTE EmployeeCompensation per FTE Public master’sPublic bachelor’scollegePrivate researchPrivate master’sPrivate bachelor’sAll data were converted to 2010 dollars before the percent change was calculated. Salary and compensation outlays are reported per full-time equivalent (FTE) employee, but most part-time faculty/staff are not eligible for benets, so benet outlays are shown per full-time employee. Per FTE employee calculations exclude part-time graduate assistants/instructors.Source: Delta Cost Project IPEDS database, 1987–2010, 11-year matched set; IPEDS Fall Staff and Salary Surveys, 2001 and 2009.Figure 8Benets costs are driving increases in overall compensation costs, FY 2002–FY 2010Annual percent change in compensation measures, FY 2002–FY 2010 For more than a decade, colleges and universities have tried to manage costs by increasingly relying on part-time instructors. Wealthier institutions—such as research universities and private colleges—have been able to add instructional capacity at lower cost by hiring part-time faculty, while public nonresearch colleges have relied on these less-expensive instructors at the expense of full-time faculty. But at the same time, institutions have added new, nonfaculty professionals whose salary and benets packages tend to be higher than those of part-time instructors (but less than full professors). Many of these new positions appear to be providing student services, but whether they represent justiable expenses or unnecessary “bloat” is up for debate. With benets costs—rather than salaries—driving much of the increase in overall compensation costs, hiring part-time instructors has been the most common approach to trimming faculty compensation costs. However, as colleges have hired additional professional staff, they have eliminated much of the cost savings from using part-time instructors, although, for the most part, these shifts still limited increases in overall salary costs per employee (except at public research universities). Higher benets costs, rather than rising salaries, led to moderate increases in overall compensation costs.Although private institutions were more successful than public institutions in controlling compensation costs per employee (in part, because benets represent a smaller portion of their overall compensation packages), their compensation costs increased slightly faster when measured against student enrollment because new employee hiring outpaced growth in student enrollment. But in public institutions, rising student enrollments meant that compensation costs per student grew more slowly than compensation costs per employee, although institutions will still need There is no single, smoking gun responsible for rising higher education prices. Even though compensation costs have risen modestly across the higher education sector, these increases emanated from the combined effects of controlling full-time faculty costs, rising benets costs, and hiring patterns that favor noninstructional professional positions, while offsetting the cost savings from using more part-time faculty. Although compensation is a major component of higher education costs, other noncompensation expenses and the decline of institutional subsidies, which shifted more costs onto students, also have Delta Cost Project| 23 Absolute ChangePercent ChangeHeadcount employees per 1,000 FTE studentsPublic master’sPublic bachelor’scollegesPrivate researchPrivate master’sPrivate bachelor’sFull-time equivalent (FTE) employees per 1,000 FTE studentsPublic master’sPublic bachelor’scollegesPrivate researchPrivate master’sPrivate bachelor’sSource: Delta Cost Project IPEDS Database, 1987–2010; 24-year matched set; IPEDS Fall Staff Survey, 2011. Appendix Table 1Average headcount and full-time equivalent (FTE) employees per 1,000 FTE students, Absolute ChangePercent ChangePublic researchTotal headcount employeesPart-time facultyPart-time facultyPart-time instructors/Executive, administrative, and managerialPublic master’sTotal headcount employeesPart-time facultyExecutive, administrative, and managerialPublic bachelor’sTotal headcount employeesPart-time facultyExecutive, administrative, and managerialPublic community collegesTotal headcount employeesPart-time facultyExecutive, administrative, and managerialAppendix Table 2Number of employees by job classication, 1990–2012 Delta Cost Project| 24 Absolute ChangePercent ChangePrivate researchTotal headcount employeesPart-time facultyPart-time facultyPart-time instructors/Executive, administrative, and managerialPrivate master’sTotal headcount employeesPart-time facultyExecutive, administrative, and managerialPrivate bachelor’sTotal headcount employeesPart-time facultyExecutive, administrative, and managerialSource: Delta Cost Project IPEDS Database, 1987–2010; 24-year matched set; IPEDS Fall Staff Survey, 2011. Delta Cost Project| 25 Delta Cost Project| 26 Absolute ChangePercent ChangePublic researchPart-time facultyPart-time facultyPart-time instructors/Executive, administrative, and managerialPublic master’sPart-time facultyExecutive, administrative, and managerialPublic bachelor’sPart-time facultyExecutive, administrative, and managerialPublic community collegesPart-time facultyExecutive, administrative, and managerialAppendix Table 3Average number of employees per 1,000 full-time equivalent (FTE) students, by job classication, 1990–2012 Delta Cost Project| 27 Absolute ChangePercent ChangePrivate researchPart-time facultyPart-time facultyPart-time instructors/Executive, administrative, and managerialPrivate master’sPart-time facultyExecutive, administrative, and managerialPrivate bachelor’sPart-time facultyExecutive, administrative, and managerialSource: Delta Cost Project IPEDS Database, 1987–2010; 24-year matched set; IPEDS Fall Staff Survey, 2011. Delta Cost Project| 28 researchmaster’sbachelor’scollegesPrivate researchPrivate master’sPrivate bachelor’sAverage annual percent change (above average changes shown in bold)Total InstructionPublic serviceAcademic supportInstitutional supportStudent services: All of the expenditure categories were standardized using total FTE staff (excluding research assistants); stafng data for each expenditure category are unavailable. Data were adjusted for ination before percent change was calculated.Source: Delta Cost Project IPEDS Database, 1987–2010; 11-year matched set.Appendix Table 4Change in wage and salary expenditures per total FTE staff, FY 2002–FY 2010 Increase reects the change in ination-adjusted tuition and fees between 1990–91 and 2012–13 (The College Board, 2012). Although athletic staff are included within the professional staff category and the rise in athletic spending is well documented, it is unlikely that this is driving the increase in these types of staff positions. Growth in professional jobs is widespread across all sectors, including those with little or no presence in highly competitive college sports (see Desrochers, 2013). Most contingent faculty members are part time, but about 15 percent of all faculty/instructors hold full-time, non-tenure-track appointments (American Federation of Teachers, 2009). Among full-time faculty only, the share of non-tenure-track professors increased about 3 percentage points between 2004 and 2012. By 2012, these non-tenure-track positions represented more than one third of assistant professors, 18 percent of associate professors, and 12 percent of full professors (American Federation of Teachers, 2013). It is difcult to determine how many graduate assistants are instructors and how many are serving as teaching or research assistants. But given the small share of part-time faculty (relative to total faculty) at research institutions compared with nonresearch institutions, a signicant number of graduate assistants are likely providing instruction. “Professors” include full professors, associate professors, and assistant professors. Lecturers and other faculty are full-time instructors who do not hold appointments as professors.Clerical job cuts are evident in the research sectors.Total “education and general” (E&G) spending captures the majority of expenditures in higher education, including spending on instruction, research, public service, student services, institutional support, academic support, operations and maintenance, and net scholarships and fellowships. Spending on auxiliary services, such as dining halls and bookstores, hospitals, and other independent operations, is excluded. Across public institutions, average E&G spending per FTE student declined after the 2001 recession and then began to rebound in the middle of the decade. During the 1990s, slower overall employment growth was comprised of rapid growth in cost-saving part-time positions and less rapid growth in more expensive professional positions, which may have resulted in a net cost savings. During the 2000s, when overall employment growth increased, the expanded growth in part-time positions may no longer have been enough to offset the more moderate (but still expanded) growth in more expensive professional positions, thereby eliminating any cost savings during “Education and related” (E&R) spending captures expenditures related to the academic mission of higher education and excludes spending on sponsored research and public service. E&R spending includes instruction, student services, and a pro rata share of spending on academic support, institutional support, and operations and maintenance. Instructional spending per FTE faculty declined in most sectors, notably among private institutions. This may appear at odds with the full-time faculty salary data that show modest growth in the private sector, but increases in part-time faculty (equated to an FTE) help lower overall instructional spending per FTE faculty member.Average pay per course varies considerably by sector and type of institution, ranging from $2,250 at public associate colleges to $3,800 at private research universities (Curtis & Thornton, 2013, Table B).For a full explanation of cost shifting in higher education, see Desrochers & Wellman, In the public sector, state appropriations account for most institutional subsidies; in the private, not-for-prot sector, subsidies generally come from endowment or investment returns.Academic support includes activities that support instruction, research, and public service—such as libraries, academic computing, museums, and deans’ ofces. Institutional support includes general administrative services, executive management, legal and scal operations, and similar activities. Student services include noninstructional student-related activities, such as admissions, registrar, career counseling, nancial aid, student organizations, and intramural athletics.Between 2002 and 2010, the benets share of full-time faculty costs rose slightly faster in community colleges, by 3.5 percentage points, while increasing less at private bachelor’s institutions, by 1.6 percentage points.Industrywide data show that the benets share of compensation is nearly 20 percent in private industries and 25 percent in state and local government (excluding vacation, sick leave, and supplemental pay, which are not captured in IPEDS benets data). In the early 2000s, benets costs were rising by 2 to 4 percent per year industrywide, after adjusting for ination. Since 2005, private-industry benets costs rose by less than 2 percent per year (declining in some years), while benet cost increases slowed in state and local government, but still increased by 1 percent and 3 percent, respectively, in most years (Employee Benet Research Institute 2009; U.S. Department of Labor, 2012). ReferencesAmerican Federation of Teachers. (2009). American academic: The state of the higher education workforce 1997–2007. Washington, DC: Author. Retrieved from http://www.aftface.org/storage/face/documents/ameracad_report_97-07for_web.pdfAmerican Federation of Teachers. (2013). Higher Education Data Center. Retrieved Archibald, R. B., & Feldman, D. H. (2008). Explaining increases in higher Journal of Higher Education, 79(3), 268–295.Archibald, R. B., & Feldman, D. H. (2011). Why does college cost so much? New York: Oxford University Press.Baumol, W. J., & Bowen, W. G. (1966). Performing arts: The economic dilemma. New York: Twentieth Century Fund.Belkin, D., & Thurm, S. (2012, December 28). Dean’s list: Hiring spree fattens Wall Street Journal. Retrieved from online.wsj.com/article/SB1000142412788732331680457816149071604Bennett, D. L. (2009, April). Trends in the higher education labor force: Identifying changes in worker composition and productivity. Washington, DC: Center for College Affordability and Productivity.Bettinger, E. P., & Long, B. T. (2010, August). Does cheaper mean better? The impact of using adjunct instructors on student outcomes. Review of Education and Statistics, 92(3), 598–613.Bowen, H. R. (1980). The costs of higher education: How much do colleges and universities spend per student and how much should they spend? Francisco: Jossey-Bass.Carnegie Foundation for the Advancement of Teaching. (2013). Classication Description. Retrieved from http://classications.carnegiefoundation.org/Clery, S. B. (2013). Faculty salaries: 2011–12. education. Washington, DC: National Education Association.Trends in college pricing, 2012 (Table 2). New York: Author. College and University Professional Association for Human Resources. (2013a). Faculty in higher education salary survey: For the 2012–13 academic year. Knoxville, TN: CUPA_HR.College and University Professional Association for Human Resources. (2013b). Administrators in higher education salary survey: For the 2012–13 academic year. Knoxville, TN: CUPA_HR. Curtis, J. W., & Thornton, S. (2013, March/April). Here’s the news: The annual report on the economic status of the profession, 2012–13. Desrochers, D. M. (2013). Academic spending versus athletic spending: Who wins? Washington, DC: Delta Cost Project.Desrochers, D. M., & Wellman, J. V. (2011). Trends in college spending: 1999–2009. Washington, DC: Delta Cost Project. Retrieved from http://www.deltacostproject.org/resources/pdf/Trends2011_Final_090711.pdfEhrenberg, R. G., & Zhang, L. (2005). Do tenured and tenure-track faculty matter? Journal of Human Resources, 40(3), 647–659.Employee Benet Research Institute. (2009). Employer costs for employee compensation and percentage of full-time employees participating in employee benet programs: State and local governments and private sector (Figure 42.1). In Fundamentals of employee benet programs (6th ed., Chapter 42, pp. 419–426). Washington, DC: Author. Retrieved from http://www.ebri.Figlio, D. N., Schapiro, M. O., & Soter, K. B. (2013). Are tenure track professors better teachers? (NBER Working Paper No. 19406). Retrieved from www.nber.org/papers/w19406Ginsburg, B. (2011a). The fall of the faculty: The rise of the all-administrative university. New York: Oxford University Press.Ginsburg, B. (2011b, September/October). Administrators ate my tuition: Want to get college costs in line? Start by cutting the overgrown management ranks. The Washington Monthly.Greene J. P., Kisida, B., & Mills. J. (2010, August 17). American universities: The real reason for high costs in higher education (Institute Policy Report No. 239). Phoenix, AZ: Goldwater.Hechinger, J. (2012, November 14). Bureaucrats paid $250,000 feed outcry over Bloomberg News. Retrieved from http://www.bloomberg.com/news/2012-11-14/bureaucrats-paid-250-000-feed-outcry-over-college-costs.Leslie, L. L., & Rhoades, G. (1995). Rising administrative costs: Seeking Journal of Higher Education, 66(2), 187–212.Martin, R. E., & Carter Hill, R. (2013). Measuring Baumol and Bowen effects in public research universities (SSRN Working Paper Series). Retrieved from http://papers.ssrn.com/sol3/papers.cfm?abstract_id=2153122National Center for Education Statistics. (2007). Full-time instructional faculty in degree-granting institutions, by race/ethnicity and residency status, sex, and academic rank: Fall 2003 and fall 2005 (Table 232). Digest of Education Statistics: 2006. Retrieved from http://nces.ed.gov/programs/digest/d06/ IPEDS 2011–12—Survey materials: Human resources for degree-granting 4 year institutions and related administrative ofces that have 15 or more full-time staff. Retrieved from http://nces.ed.gov/ipeds/surveys/2011/pdf/hr_4_15dg_2011.pdfNational Center for Education Statistics. (2013a). Percentage of full-time instructional staff with tenure for degree-granting institutions with a tenure system, by academic rank, sex, and control and level of institution: Selected years, 1993–94 through 2011–12 (Table 305). Digest of Education Statistics: 2012. Retrieved from http://nces.ed.gov/programs/digest/d12/tables/National Center for Education Statistics. (2013b). Full-time instructional faculty in degree-granting institutions, by race/ethnicity, sex, and academic rank: Fall 2007, fall 2009, and fall 2011 (Table 291). Digest of Education Statistics: 2012. Retrieved from http://nces.ed.gov/programs/digest/d12/tables/U.S. Department of Labor, Bureau of Labor Statistics. (2012). Employment cost index for benets, by occupational group, industry, and bargaining status: Constant dollars (Table 12). In Employment cost index historical listing, constant dollar: March 2001–March 2012. Retrieved from ftp://ftp.bls.gov/Vedder, R., Matgouranis, C., & Robe, J. (2011). Faculty productivity and costs at the University of Texas at Austin: A preliminary analysis. Washington, DC: Center for College Affordability and Productivity. Retrieved from http://www.centerforcollegeaffordability.org/uploads/Faculty_Productivity_UT-Austin_report.pdfZaback, K. (2011). Stafng trends in public colleges and universities: A national analysis 2001–2009. Boulder, CO: State Higher Education Executive Ofcers. Established in 1946, with headquarters in Washington, D.C., and ofces across the country, American Institutes for Research (AIR) is an independent, nonpartisan, not-for-prot organization that conducts behavioral and social science research, and delivers technical assistance both domestically and internationally in the areas of health, education, and workforce productivity. As one of the largest behavioral and social science research organizations in the world, AIR is committed to empowering communities and institutions with innovative solutions to the most critical education, health, workforce, and international development challenges. AIR currently stands as a national leader in teaching and learning improvement, providing the research, assessment, evaluation, and technical assistance to ensure that all students—particularly those facing historical disadvantages—have access to a high-quality, effective education. For more information about American Institutes for Research, visit www.air.org.The Delta Cost Project at American Institutes for Research provides data and tools to help higher education administrators and policymakers improve college affordability by controlling institutional costs and increasing productivity. The work is animated by the belief that college costs can be contained without sacricing access or educational quality through better use of data to inform strategic decision making.For more information about the Delta Cost Project, visit www.deltacostproject.org. About the AuthorsDonna M. DesrochersResearch. She was formerly the deputy director of the Delta Cost Project.Rita Kirshstein, Ph.D., director of the Delta Cost Project, is a managing director at Copyright © 2014 American Institutes for Research. All rights reserved. 1000 Thomas Jefferson Street NWWashington, DC 20007-3835