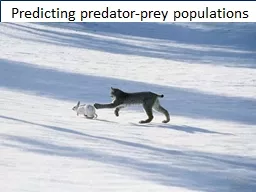
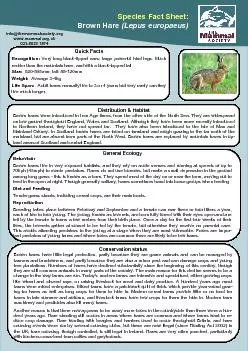
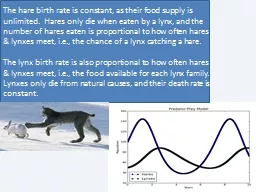
/
The hare birth rate is constant, as their food supply is unlimited.  Hares only die when The hare birth rate is constant, as their food supply is unlimited.  Hares only die when

The hare birth rate is constant, as their food supply is unlimited. Hares only die when - PowerPoint Presentation

luanne-stotts
luanne-stotts . @luanne-stotts
Follow
380 views
Uploaded On 2018-11-03

The hare birth rate is constant, as their food supply is unlimited. Hares only die when - PPT Presentation

meet ie the chance of a lynx catching a hare The lynx birth rate is also proportional to how often hares amp lynxes meet ie the food available for each lynx family Lynxes only die from natural causes and their death rate is constant ID: 711878

rate prey populations pred prey rate pred populations years death growth predation conversion plt food piece return plot population

Share:

Link:

Embed:

Download Presentation from below link

Download Presentation The PPT/PDF document "The hare birth rate is constant, as thei..." is the property of its rightful owner. Permission is granted to download and print the materials on this web site for personal, non-commercial use only, and to display it on your personal computer provided you do not modify the materials and that you retain all copyright notices contained in the materials. By downloading content from our website, you accept the terms of this agreement.


Presentation Transcript

Slide1

The hare birth rate is constant, as their food supply is unlimited. Hares only die when eaten by a lynx, and the number of hares eaten is proportional to how often hares & lynxes

meet, i.e., the chance of a lynx catching a hare.The lynx birth rate is also proportional to how often hares & lynxes meet, i.e., the food available for each lynx family. Lynxes only die from natural causes, and their death rate is constant.Slide2

Computational Thinking

Recipe (Algorithm)

Relevant input

Answer

Abstraction

Automation

Problem description

Computational goal

Information extraction

Algorithm design

Algorithm implementationSlide3

Given

, , ,

,

,

,

.

Repeat these steps for

:

Plot

for

.

Plot

for

.


Generate population data.

Repeatedly, generate next population.

Display population data.Slide4

Improve AlgorithmSeparate parts

GeneralizeArticulate goalsSlide5

Given

, , ,

,

,

,

.

Repeat these steps for

:

Plot

for

.

Plot

for

.


Generate population data.

Repeatedly, generate next population.

Display population data.Slide6

Given

, , ,

,

,

,

.

Repeat these steps for

:

Return

and

.

 Slide7

Why Separate Parts?

SimplerIndependently usefulSlide8

Generalize beyond Hares & LynxesGiven

, , ,

,

,

,

.

Repeat these steps for

:

Return

and

.

 Slide9

Articulate Goals

Populations: Given , ,

,

,

,

,

.

Returns the predicted populations of two species, given their initial populations, the prey’s growth rate, the predation rate, the predator’s food conversion rate, the predator’s death rate, and the number of years to predict.

Repeat these steps for

:

Return

and

.

 Slide10

Express as Python CodeSlide11

Use What Kinds of Python Data?Populations:

Given ,

,

,

,

,

,

.

Returns the predicted populations of two species, given their initial populations, the prey’s growth rate, the predation rate, the predator’s food conversion rate, the predator’s death rate, and the number of years to predict.

Repeat these steps for

:

Return

and

.

 Slide12

and

as Lists 


 Slide13

Translate Piece by Piece

Populations: Given , ,

,

,

,

,

.

Returns the predicted populations of two species, given their initial populations, the prey’s growth rate, the predation rate, the predator’s food conversion rate, the predator’s death rate, and the number of years to predict

.


def

populations

(

prey0,pred0,growth,predation,conversion,death,years)

:

"""

Returns the predicted populations of two species, given

their initial populations, the prey's growth rate, the predation rate, the predator's food conversion rate, the predator's death rate, and the number of years to predict."""prey = [

prey0]pred

= [pred0]Slide14

Translate Piece by Piece

Repeat these steps for :


f

or

y

in

range

(years):Slide15

prey.append

( )Translate Piece by Piece


p

rey[y]

p

rey[y] *

+

(growth-predation*

pred

[y])

pred.append

( )

pred

[y]

pred

[y] *

+

(conversion*prey[y]-death)Slide16

Translate Piece by Piece

Return and . 

return

prey

pred

,Slide17

Put the Function’s Pieces Togetherdef

populations(prey0,pred0,growth,predation,conversion,death,years): """

Returns the predicted populations of two species, given

their

initial

populations, the prey

'

s growth rate, the predation

rate, the predator'

s food conversion rate, the predator's

death rate, and the number of years to predict

."""

prey = [prey0]

pred

= [pred0]

for y in range(years): prey.append(prey[y] + prey[y] * (growth-predation*pred[y])) pred.append(pred[y] + pred[y] * (conversion*prey[y]-death)) return prey,

predSlide18

How to Use The Code?

pred

, prey =

populations(100,50,.4,.003,.004,.2,10)Slide19

A Useful Asidedef

populations(prey0,pred0,growth,predation,conversion,death,years): """

Returns the predicted populations of two species, given

their

initial

populations, the prey

'

s growth rate, the predation

rate, the predator'

s food conversion rate, the predator's

death rate, and the number of years to predict

."""

prey = [prey0]

pred = [pred0

]

for y in range(years): print "y = ", y print "prey = ",

prey

print

"

pred

= ", pred prey.append(prey[y] + prey[y] * (growth-predation*pred[y])) pred.append

(pred[y] +

pred

[y] * (conversion*prey[y]-death))

return

prey,

predSlide20

Plottingimport

matplotlib.pyplot as plt

def

plotPopulations

(

times,prey,pred,preyName,predName

):

"""Displays a plot of two populations over the given times."""

# Prey use circles connected by solid line.

preyPlot

= plt.plot(times, prey,

'o-' )

# Predators use squares connected by dotted line.

predPlot = plt.plot(times, pred, 's:' ) # Place legend box in "best" location. plt.legend((preyPlot, predPlot), (preyName

, predName),

'best

'

)

plt.xlabel

('Years') plt.ylabel('Population') plt.title('Predator-Prey Model') plt.show()Slide21

Putting Everything Togetherimport

matplotlib.pyplot as plt

def

populations

(…):

def

plotPopulations(…):

prey,

pred

= populations(100,50,.4,.003,.004,.2,10)

times = range

(len(prey))

plotPopulations

(times,prey,pred,"Hare","Lynx")