/
Predicting predator-prey populations Predicting predator-prey populations

Predicting predator-prey populations - PowerPoint Presentation

min-jolicoeur
min-jolicoeur . @min-jolicoeur
Follow
384 views
Uploaded On 2017-05-15

Predicting predator-prey populations - PPT Presentation

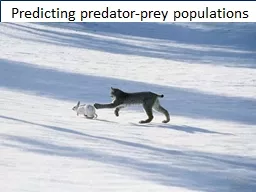
Desired results Heres an approximation of reality The hare birth rate is constant as their food supply is unlimited Hares only die when eaten by a lynx and the number of hares eaten is proportional to how often hares amp lynxes meet ie the chance of a lynx catching a hare ID: 548488

lynx hares lynxes amp hares lynx amp lynxes algorithm populations hare rate die data design population eaten year meet

Share:

Link:

Embed:

Download Presentation from below link

Download Presentation The PPT/PDF document "Predicting predator-prey populations" is the property of its rightful owner. Permission is granted to download and print the materials on this web site for personal, non-commercial use only, and to display it on your personal computer provided you do not modify the materials and that you retain all copyright notices contained in the materials. By downloading content from our website, you accept the terms of this agreement.


Presentation Transcript

Slide1

Predicting predator-prey populationsSlide2

Desired resultsSlide3

Here’s an approximation of reality:

The hare birth rate is constant, as their food supply is unlimited. Hares only die when eaten by a lynx, and the number of hares eaten is proportional to how often hares & lynxes meet, i.e., the chance of a lynx catching a hare.

The lynx birth rate is also proportional to how often hares & lynxes meet, i.e., the food available for each lynx family. Lynxes only die from natural causes, and their death rate is constant.

Lotka

&

Volterra

, 1926

Dr.

Siemann

, EEBSlide4

Computational Thinking

Recipe (Algorithm)

Relevant input

Answer

Abstraction

Automation

Problem description

Computational goal

Information extraction

Algorithm design

Algorithm implementationSlide5

Hares’ & Lynxes’ Populations

Recipe (Algorithm)

???

???

Problem description

Computational goal

Information extraction

Algorithm design

Algorithm implementationSlide6

Algorithm Design – Decomposition

Generate population data.

Repeatedly,

G

enerate next populations of predator & prey.

Display population data.Slide7

Algorithm Design – Refinement

Store original populations.

Generate population data.

Repeatedly,

G

enerate next populations of predator & prey.

Store new populations.

Display stored population data.Slide8

Lotka

&

Volterra

, 1926

The hare birth rate is constant, as their food supply is unlimited. Hares only die when eaten by a lynx, and the number of hares eaten is proportional to how often hares & lynxes

meet, i.e., the chance of a lynx catching a hare.

The lynx birth rate is also proportional to how often hares & lynxes meet, i.e., the food available for each lynx family. Lynxes only die from natural causes, and their death rate is constant

.


Hare annual pop. change


Lynx annual pop. changeSlide9

Initially

(Year 0)

Year 1

Year 2

Year 3

# Hares

100

Hares

born

4

0

Hares

eaten

15

#

Lynxes

50

125

60

152

78

17

7

109

Lynxes

die

10

Lynxes

born

2

0

50

23

12

30

61

36

16

47

71

5

8

22

77

+

-

-

+

.4

.003

.004

.2


Hare annual pop. change


Lynx annual pop. change

Rounding

all #

s.Slide10

Algorithm Design – Refinement

Given

,

,

,

,

,

,

.

Store

in

. Store

in

.

Repeat for

:

Compute

Add

to end of

. Add

to end of

.

Plot

and

.

 Slide11

Suggested Readings

Predator-prey models

Lotka-Volterra

equationWolves & Moose of Isle Royale

E

sp. the

Data sectionA technical paper about population cycles