PPT-Seminal Analysis Methodology Based on Uncorrelated Data Collection in Either Benign or
Author : luna | Published Date : 2024-01-13
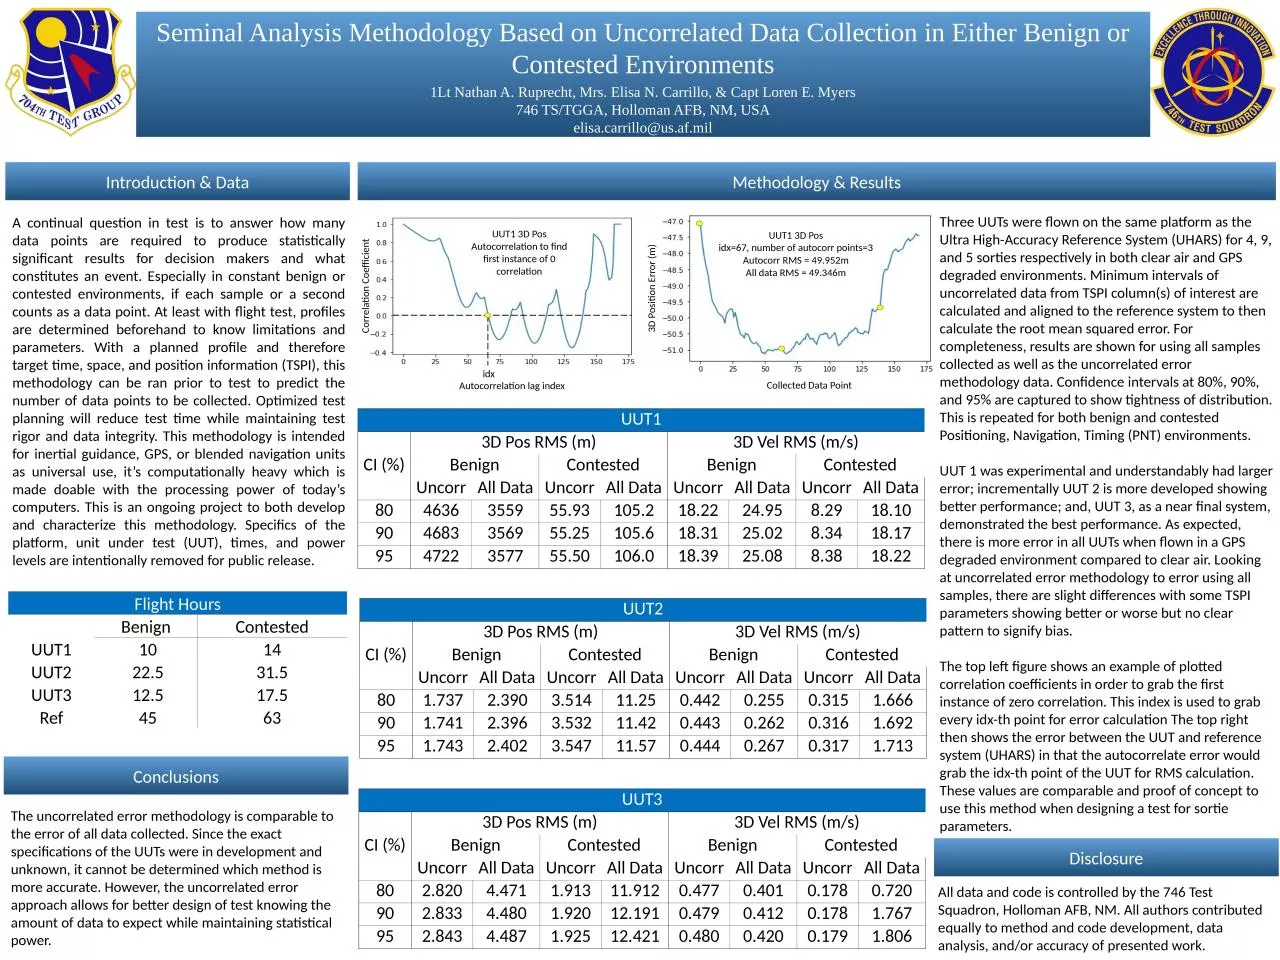
1Lt Nathan A Ruprecht Mrs Elisa N Carrillo amp Capt Loren E Myers 746 TSTGGA Holloman AFB NM USA elisacarrillousafmil Three UUTs were flown on the same platform
Presentation Embed Code
Download Presentation
Download Presentation The PPT/PDF document "Seminal Analysis Methodology Based on Un..." is the property of its rightful owner. Permission is granted to download and print the materials on this website for personal, non-commercial use only, and to display it on your personal computer provided you do not modify the materials and that you retain all copyright notices contained in the materials. By downloading content from our website, you accept the terms of this agreement.
Seminal Analysis Methodology Based on Uncorrelated Data Collection in Either Benign or: Transcript
Download Rules Of Document
"Seminal Analysis Methodology Based on Uncorrelated Data Collection in Either Benign or"The content belongs to its owner. You may download and print it for personal use, without modification, and keep all copyright notices. By downloading, you agree to these terms.
Related Documents