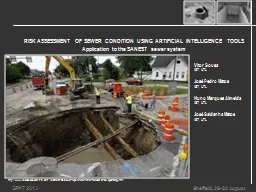
Application to the SANEST sewer system Vitor Sousa IST UTL José Pedro Matos IST UTL Nuno Marques Almeida IST UTL José Saldanha Matos IST UTL httpwwwtoledobladecomPoliceFire20130706SewerrepairsstartafterintersectioncollapseCopyhtml ID: 830520
Download The PPT/PDF document "RISK ASSESSMENT OF SEWER CONDITION USING..." is the property of its rightful owner. Permission is granted to download and print the materials on this web site for personal, non-commercial use only, and to display it on your personal computer provided you do not modify the materials and that you retain all copyright notices contained in the materials. By downloading content from our website, you accept the terms of this agreement.
Slide1
RISK ASSESSMENT OF SEWER CONDITION USING ARTIFICIAL INTELLIGENCE TOOLS Application to the SANEST sewer system
Vitor SousaIST, UTLJosé Pedro MatosIST, UTLNuno Marques AlmeidaIST, UTLJosé Saldanha MatosIST, UTL
http://www.toledoblade.com/Police-Fire/2013/07/06/Sewer-repairs-start-after-intersection-collapse-Copy.html
Slide2OUTLINE
IntroductionSewer condition modellingSANEST sewer systemData collectionModel designArtificial Neural NetworksSupport Vector MachinesDiscriminant analysis
Conclusions
Slide31. INTRODUCTION
Wastewater drainage systems asset management strategiesReactiveProactive:prevention-based (or based on age); inspection-based (or based on condition);
prediction-based
(or based on reliability
)
;
The concept of risk has also been used in managing wastewater drainage assets, either:
Indirectly – by indentifying critical sewers (managed proactively) and non-critical sewers (managed reactively
)
Directly – through the development of multicriteria tools accounting also for the consequences of the sewers failures
(
MARESS - Reyna 1993; RERAUVIS - RERAU 1998; CARE-S - CARE‑S 2005)
Slide42. SEWER CONDITION MODELLING
CATEGORYCLASSTYPEREFERENCES
Function-based
Deterministic
Linear regression
Chughtay and Zayed (2007a, 2007b, 2008)
Non-linear regression
Newton and Vanier (2006); Wirahadikusumah et al. (2001)
Stochastic
Survival function
Hörold and Baur (1999); Baur and Herz (2002); Baur et al. (2004); Ana (2009)
Ordinal regression
Yang (1999); Davies et al. (2001b);
Ariaratnam
et al.
(2001); Pohls (2001); Ana (2009)
Markov chains
Wirahadikusumah
et al. (2001);
Micevski
et al. (2002);
Coombes
et al. (2002);
Baik
et al.
(2006); Koo and Ariaratnam (2006); Newton and Vanier (2006); Tran (2007); Le Gat (2008)
Semi-Markov chains
Kleiner
(2001); Dirksen and Clemens (2008); Ana (2009)
Discriminant analysis
Tran (2007); Ana (2009)
Data-based
Artificial inteligence
Artificial Neural Networks – ANNs
Najafi
and
Kulandaivel
(2005); Tran et al. (2006); Tran (2007); Ana (2009); Khan et al.
(2010)
Fuzzy Set
Yan and
Vairavamoorthy
(2003);
Kleiner
et al. (2004a, 2004b, 2006)
Case Based Reasoning – CBR
Fenner et al. (2007)
Support Vector Machines – SVMs
Mashford et al. (2011)
Genetic programing
Evolutionary Polynomial Regression – EPR
Savic
et al. (2006);
Ugarelli
et al.
(2008); Savic et al. (2009)
Slide53. SANEST SEWER SYSTEM
http://www.sanest.pt/artigo.aspx?sid=e73adb75-e84d-46ae-b578-50a5ee934cc2&cntx=d00N%2Fz8yc6LPuMNx72xjzkHnWQg%2Bm23akSu576zxbEk%3D
Slide6Material / Diameter
Sewers [nº]Total length [m]
Average age [years]
Average depth [m]
Average slope [%]
Average length [m]
VC (1)
134
4370.50
54.55
2.52
2.14
32.62
2007186.1345.002.681.3226.5925015389.4158.132.411.0925.96300381232.8549.741.982.9532.44350692484.6858.172.821.8336.01400142.2339.002.311.1142.23PC (2)531408.7029.852.472.0826.58315151.2630.002.732.0951.26500521357.4429.852.472.0826.10PVC (3)34812682.2011.532.881.7236.44200380.448.002.197.2226.81250592291.4610.372.344.1438.8431538957.0312.392.460.9025.194001124347.9011.592.981.7538.82500732868.8112.263.030.8739.30630271132.6410.373.120.8141.9570030915.3812.003.470.5330.51800688.5412.003.470.3414.76HDPE (4)1224102.049.843.531.2333.62360381206.4710.003.700.9631.754004111.039.753.311.6827.764504217.339.002.071.2654.33500662154.489.923.761.5032.6460010412.739.002.080.2741.27C-PP (5)601771.999.653.021.5129.5331526908.069.964.422.8334.934004122.8912.003.230.2630.7250029713.709.031.720.4624.61630127.3410.003.402.7127.34C-PVC (6)281033.744.423.871.2439.763507165.006.202.832.7133.0040021868.744.004.120.8941.37Total74525369.1719.922.941.7134.14
4
. DATA COLLECTION
Slide75. MODEL DESIGN
The sewer operational and structural condition classes were determined from the CCTV inspection results using the WRc (2001) rating protocol.Two alternative approaches were used to reduce number of condition classes used as outputs:ALT A – the sewers were classified into three categories representing reaches that are in good condition and are expected to endure a long period before the next inspection (category 0 – sewers in condition 1 and 2), sewers that require a shorter period of time until the next inspection (category 1 – sewers in condition 3) and sewers that are failing and should be intervened in the short term (category 2 –sewers in condition 4 and 5)
ALT B – the sewers were divided into those that require intervention (category 2 – sewers in condition 4 and 5) and those which do not require intervention (category 1 – sewers in condition 1, 2 and 3
).
Slide86. ARTIFICIAL NEURAL NETWORKS
ANNsFor the classification case of the sewers' structural condition according to ALT B, the corresponding ANN presented was used to evaluate the effect of the initial weights of the neuron connections.
Randomly varying the initial weights of the neuron connections in 100 ANNs resulted in correlations ranging from 67% to 79%, for the train data (average=73%), and from 72% to 84%, for the test data (average=76%).
Classification Case
Train Algorithm
Error Function
Correlation
Number of neurons
Activation function
Train
Test
Hidden Layer
Output Layer
Hidden LayerOutput LayerOperational – ALT ABFGSCE61.8066.67153Hiperbolic TangentSoftmaxStructural – ALT ABFGSSOS68.5271.85293Hiperbolic TangentSigmoid LogisticOperational – ALT BBFGSCE80.0082.96192Sigmoid LogisticSoftmaxStructural – ALT BBFGSSOS75.7482.22182Sigmoid LogisticSigmoid Logistic
Slide96. ARTIFICIAL NEURAL NETWORKS
ALT AALT B
OBSERVED
PREDICTED (Operational)
Correct / Incorrect
PREDICTED (Structural)
Correct / Incorrect
Category
0
1
2
0
1
2072358.3% / 41.7%51083.3% / 16.7%11149476.6% / 23.4%7551175.3% / 24.7%212133457.6% / 42.4%5143766.1% / 33.9%Correct / Incorrect23.3% / 76.7%76.6% / 23.4%82.9% / 17.1%66.7% / 33.3%29.4% / 70.6%78.6% / 21.4%77.1% / 22.9%71.9% / 28.1%OBSERVEDPREDICTED (Operational)Correct / IncorrectPREDICTED (Structural)Correct / IncorrectCategory12121851485.9% / 14.1%751286.2% / 13.8%292775.0% / 25.0%123575.0% / 25.0%Correct / Incorrect90.4% / 9.6%65.9% / 34.1%83.0% / 17.0%86.2% / 18.8%75.0% / 25.0%82.2% / 17.8%
Slide107. SUPPORT VECTOR MACHINES
ALT AALT B
OBSERVED
PREDICTED (Operational)
Correct / Incorrect
PREDICTED (Structural)
Correct / Incorrect
Category
0
1
2
0
1
201701750% / 50%1461046.7% / 53.3%17064645.7% / 54.3%17371057.8% / 42.2%248163233.3% / 66.7%1202970.7% / 29.3%Correct / Incorrect12.6% / 87.4%80.0% / 20.0%58.2% / 41.8%41.9% / 58.1%32.6% / 67.4%86.0% / 14.0%59.2% / 40.8%59.3% / 40.7%OBSERVEDPREDICTED (Operational)Correct / IncorrectPREDICTED (Structural)Correct / IncorrectCategory12121831188.3% / 11.7%80792.0% / 8.0%2182356.1% / 43.9%321633.3% / 66.7%Correct / Incorrect82.2% / 17.8%67.6% / 32.4%78.5% / 21.5%71.4% / 28.6%69.6% / 30.4%71.1% / 28.9%
Slide118. DISCRIMINANT ANALYSIS
ALT AALT B
OBSERVED
PREDICTED (Operational)
Correct / Incorrect
PREDICTED (Structural)
Correct / Incorrect
Category
0
1
2
0
1
201261240.0% / 60.0%411223.5% / 76.5%115371257.8% / 42.2%0561480.0% / 20.0%21202970.7% / 29.3%0272143.8% / 56.3%Correct / Incorrect30.8% / 69.2%86.0% / 14.0%54.7% / 45.3%57.8% / 42.2%100.0% / 0.0%59.6% / 40.4%56.8% / 43.2%60.0% / 40.0%OBSERVEDPREDICTED (Operational)Correct / IncorrectPREDICTED (Structural)Correct / IncorrectCategory12121841089.4% / 10.6%79890.8% / 9.2%2172458.5% / 41.5%301837.5% / 62.5%Correct / Incorrect83.2% / 16.8%70.6% / 29.4%80.0% / 20.0%72.5% / 72.5%69.2% / 30.8%71.9% / 28.1%
Slide129. CONCLUSIONS
The different methods yielded very similar overall result. Since the main goal of modelling the condition of sewers is to identify the sewer reaches that may need intervention, the ANNs’ results provided better results given the approach adopted. However, contrarily to the SVMs and discriminant analysis, the ANNs’ results depend significantly in various factors.
The increase of the number of classes resulted in a decrease in the models accuracy.
Slide13REFERENCES
Ana, E. V. (2009). Sewer asset management - sewer structural deterioration modeling and multicriteria decision making in sewer rehabilitation projects prioritization. PhD Thesis, Faculty of Engineering, Vrije Universiteit Brussel, Brussels, Belgium. Ariaratnam, T. S.; Assaly, E. A.; Yuqing, Y. (2001). Assessment of infrastructure inspection needs using logistic models. Journal of Infrastructure Systems, 7(4):66-72. Baik
, H. S.; Jeong, H. S.; Abraham, D. M. (2006). Estimating transition probabilities in
markov
chain-based deterioration models for management of wastewater systems. Journal of Water Resources Planning and Management, 132(1):15-24.
Baur
, R.;
Herz
, R. (2002). Selective inspection planning with ageing forecast for sewer types. Water Science and Technology, 46(6-7):379-387.
Baur
, R.;
Zielichowski
-Haber, W.;
Kropp, I. (2004). Statistical analysis of inspection data for the asset management of sewer networks. In Proceedings 19th EJSW on Process Data and Integrated Urban Water Modeling, Lyon, France. Chughtai, F; Zayed, T. (2007a). Structural condition models for sewer pipeline. Pipelines 2007: Advances and Experiences with Trenchless Pipeline Projects, 8–11 July, Boston, USA. Chughtai, F; Zayed, T. (2007b). Sewer pipeline operational condition prediction using multiple regression. Pipelines 2007: Advances and Experiences with Trenchless Pipeline Projects, 8–11 July, Boston, USA. Chughtai, F; Zayed, T. (2008). Infrastructure condition prediction models for sustainable sewer pipelines. Journal of Performance of Constructed Facilities, 22(5):333-341.Davies, J.; Clarke, B.; Whiter, J.; Cunningham, R. (2001). The structural condition of rigid sewer pipes: a statistical investigation. Urban Water, 3:277-286. Dirksen, J.; Clemens, F. H. L. R. (2008). Probabilistic modeling of sewer deterioration using inspection data. Water Science & Technology, 57(10):1635-1641. Fenner, R. A.; McFarland, G.; Thorne, O. (2007). Case-based reasoning approach for managing sewerage assets. Proceedings of the Institution of Civil Engineers, Water Management, 160(WM1):15–24.
Slide14REFERENCES
Hörold, S.; Baur, R. (1999). Modeling sewer deterioration for selective inspection planning – case study Dresden. In Proceedings 13th EJSW on Service Life Management Strategies of Water Mains and Sewers, 8-12 September, Switzerland. Khan, Z.; Zayed, T.; Moselhi, O. (2010). Structural condition assessment of sewer pipelines. Journal of Performance of Constructed Facilities, 24(2):170-179. Kleiner, Y. (2001). Scheduling inspection and renewal of large infrastructure assets. Journal of Infrastructure Systems, 7(4):136-143.
Kleiner, Y.;
Rajani
, B.;
Sadiq
, R. (2004a).
Modeling failure risk in buried pipes using fuzzy Markov deterioration process”, 4th International Conference on Decision Making in Urban and Civil Engineering, 28-30 October, Porto, Portugal, pp. 1-11.
Kleiner
, Y.;
Sadiq
, R.;
Rajani
, B. (2004b). Modeling failure risk in buried pipes using fuzzy Markov deterioration process. Pipelines 2004, Conference Proceedings, ASCE, San Diego, California, USA, pp. 7-16. Kleiner, Y.; Sadiq, R.; Rajani, B. B. (2006). Modelling the deterioration of buried infrastructure as a fuzzy Markov process. Journal of Water Supply Research and Technology: Aqua, 55(2):67-80. Koo, D.-H.; Ariaratnam, S. T. (2006). Innovative method for assessment of underground sewer pipe condition. Automation in Construction, 15:479-488. Le Gat, Y. (2008). Modelling the deterioration process of drainage pipelines. Urban Water, 5(2):97-106. Mashford, J.; Marlow, D.; Tran, T.; May, R. (2011). Prediction of Sewer Condition Grade Using Support Vector Machines. Journal of Computing in Civil Engineering, 25(4):283-290. Micevski, T.; Kuczera, G.; Coombes, P. (2002). Markov model for storm water pipe deterioration. Journal of Infrastructure Systems, 8(2):49–56. multi-objective data mining. Journal of Hydroinformatics, 11(3–4):211-224. Najafi, M.; Kulandaivel, G. (2005). Pipeline condition prediction using neural network models. Pipelines 2005, ASCE, Reston, VA, USA, pp. 767–775.
Slide15REFERENCES
Pohls, O. (2001). The analysis of tree root blockages in sewer lines & their prevention methods. MSc. Thesis, Institute of Land and Food Resources, University of Melbourne, Melbourne, Australia. Savic, D. A.; Giustolisi, O.; Laucelli, D. (2009). Asset deterioration analysis using multi-utility data and Savic, D.; Giustolisi
, O.; Berardi, L.; Shepherd, W.;
Djordjevic
, S.; Saul, A. (2006).
Modelling
sewer failure by evolutionary computing. Proceedings of the Institution of Civil Engineers, Water Management, 159(WM2):111-118.
Tran, D. H.; Ng, A. W. M.; Perera, B. J. C.; Davis, P. (2006).
Application of probabilistic neural networks in modeling structural deterioration of
stormwater
pipes. Urban Water Journal, 3(3):175–184.
Tran, H. (2007) Investigation of deterioration models for
stormwater
pipe systems. PhD Thesis, Victoria University, School of Architectural, Civil and Mechanical Engineering Faculty of Health, Engineering and Science, Victoria, Australia. Ugarelli, R.; Kristensin, S. M.; Røstum, J.; Sægrov, S.; Di Frederico; V. (2008). Statistical analysis and definition of blockages-prediction formulae for the wastewater network of Oslo by evolutionary computing. 11th International Conference in Urban Drainage, Edinburgh, Scotland, UK. Wirahadikusumah, R.; Abraham, D.; Iseley, T. (2001). Challenging issues in modeling deterioration of combined sewers. Journal of Infrastructure Systems, 7(2):77-84. Yan, J.; Vairavamoorthy, K. (2003). Fuzzy approach for pipe condition assessment. Proc., New Pipeline Technologies, Security, and Safety, ASCE, Reston, Va., pp. 466–476. Yang, Y. (1999). Statistical models for assessing sewer infrastructure inspection requirements. MSc. Thesis, Department of Civil and Environmental Engineering, University of Alberta, Edmonton, Alberta, Canada.
Slide16RISK ASSESSMENT OF SEWER CONDITION USING ARTIFICIAL INTELLIGENCE TOOLS Application to the SANEST sewer system
Vitor SousaIST, UTLJosé Pedro MatosIST, UTLNuno Marques AlmeidaIST, UTLJosé Saldanha MatosIST, UTL
http://www.toledoblade.com/Police-Fire/2013/07/06/Sewer-repairs-start-after-intersection-collapse-Copy.html