/
A publication of the Centers for Medicare  Medicaid Services31 Of A publication of the Centers for Medicare  Medicaid Services31 Of

A publication of the Centers for Medicare Medicaid Services31 Of - PDF document

madeline
madeline . @madeline
Follow
342 views
Uploaded On 2022-10-28

A publication of the Centers for Medicare Medicaid Services31 Of - PPT Presentation

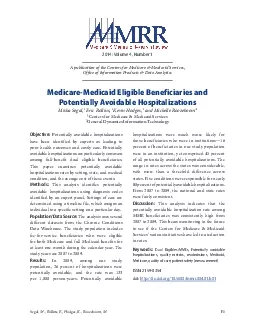
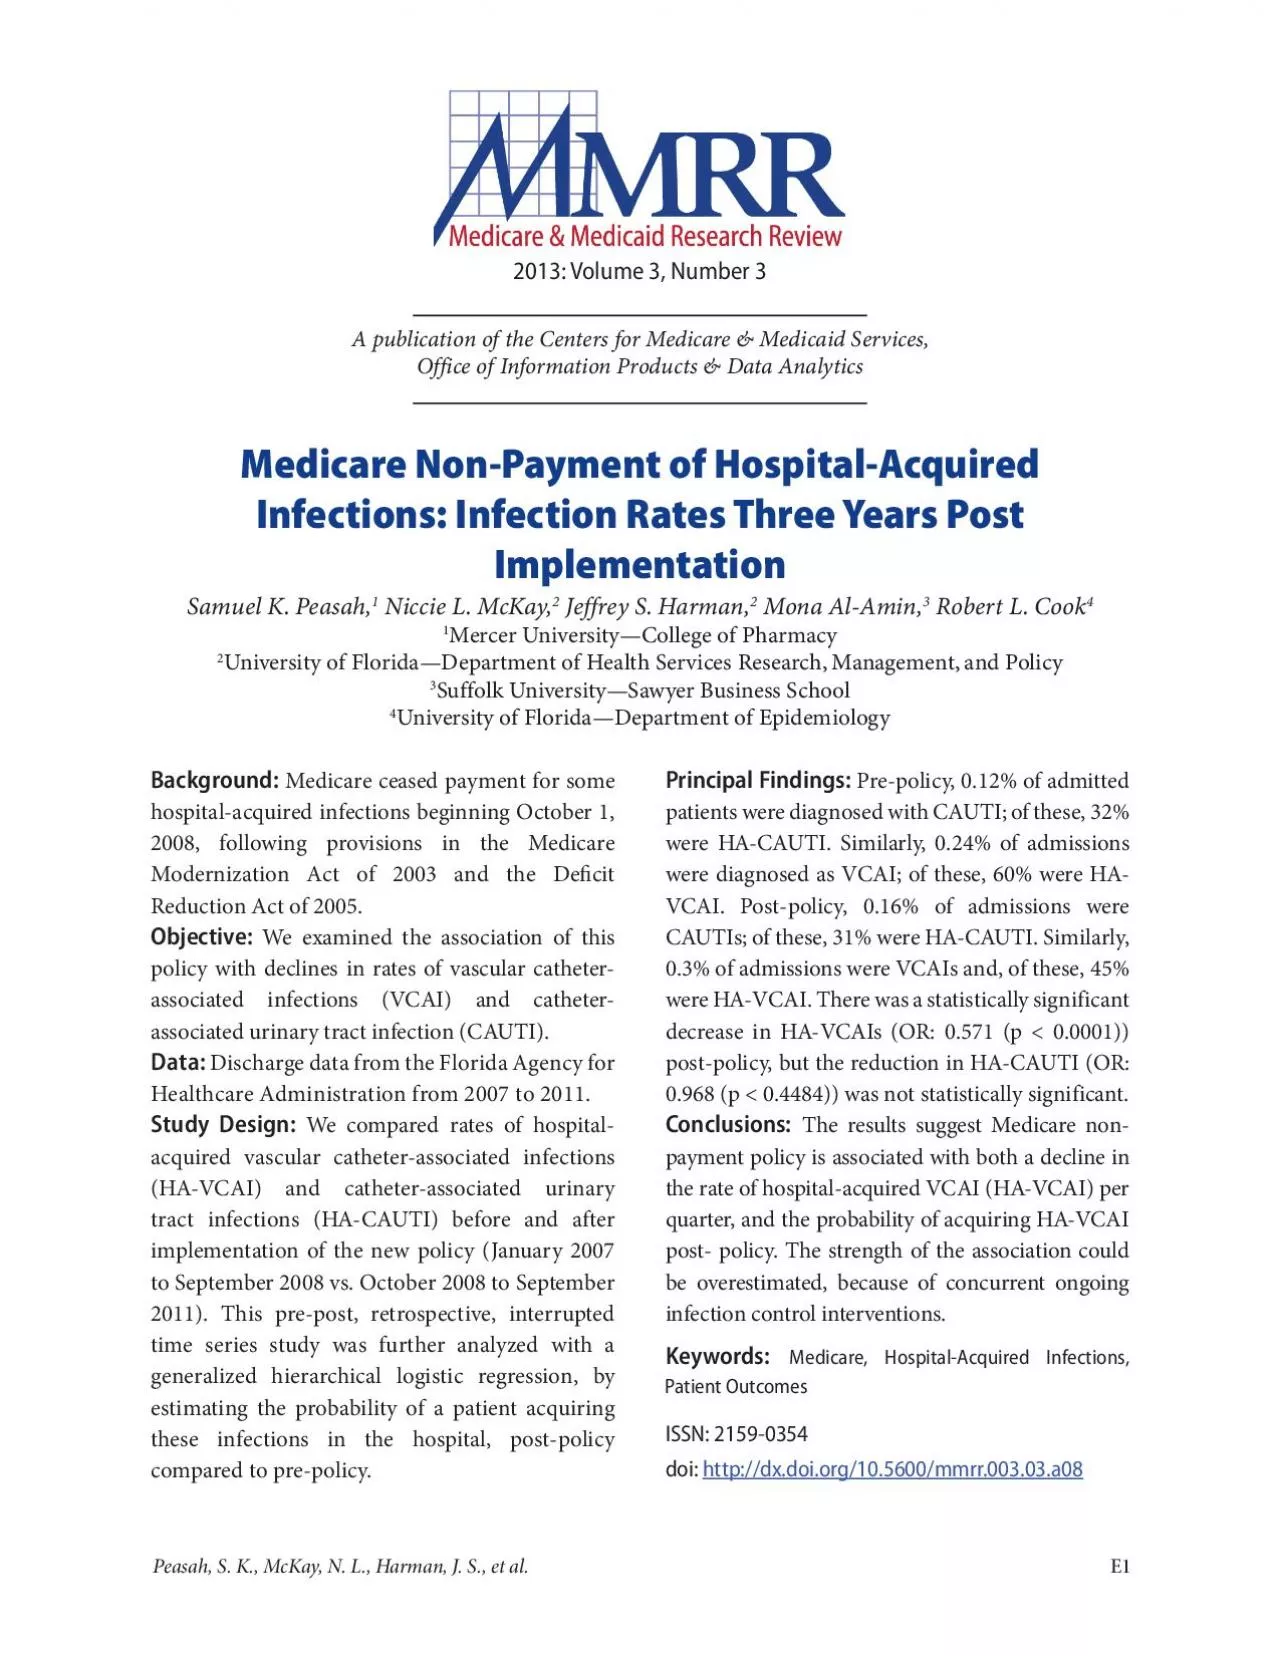
Medicare NonPayment of HospitalAcquired 31Infections Infection Rates Three Years Post 31Implementation31 Samuel K Peasah 1 Niccie L McKay 2 Jeffrey S Harman 2 3 Robert L Cook 4 ID: 961594

hospital policy medicare vcai policy hospital vcai medicare cauti acquired infections hospitals post http proportion infection care patients patient

Share:

Link:

Embed:

Download Presentation from below link

Download Pdf The PPT/PDF document "A publication of the Centers for Medicar..." is the property of its rightful owner. Permission is granted to download and print the materials on this web site for personal, non-commercial use only, and to display it on your personal computer provided you do not modify the materials and that you retain all copyright notices contained in the materials. By downloading content from our website, you accept the terms of this agreement.


Presentation Transcript

A publication of the Centers for Medicare & Medicaid Services, Office of Information Products & Data Analytics Medicare Non-Payment of Hospital-Acquired Infections: Infection Rates Three Years Post Implementation Samuel K. Peasah, 1 Niccie L. McKay, 2 Jeffrey S. Harman, 2 3 Robert L. Cook 4 1 Mercer University—College of Pharmacy 2 University of Florida—Department of Health Services Research, Management, and Policy 3 Suffolk University—Sawyer Business School 4 Medicare ceased payment for some hospital-acquired infections beginning October 1, 2008, following provisions in the Medicare Modernization Act of 2003 and the Decit Objective: We examined the association of this policy with declines in rates of vascular catheter-associated infections (VCAI) and catheter-associated urinary tract infection (CAUTI). Data: Principal Findings: Pre-policy, 0.12% of admitted patients were diagnosed with CAUTI; of these, 32% were HA-CAUTI. Similarly, 0.24% of admissions were diagnosed as VCAI; of these, 60% were HAVCAI. Post-policy, 0.16% of admissions were 0.968 (p ))s not statistically significant. Conclusions: The results suggest Medicare nonpayment policy is associated with both a decline in the rate of hospital-acquired VCAI (HA-VCAI) per Keywords: Medicare, Hospital-Acquired Infections, Patient Outcomes ISSN: 2159-0354 doi: http://dx.doi.org/10.5600/mmrr.003.03.a08 Peasah, S. K., McKay, N. L., Harman, J. S., et al. 2013: Volume 3 (3) Medicare & Medicaid Research Review 2013: Volume 3, Number 3 Mission Statement Medicare & Medicaid Research Review is a peer-reviewed, online journal reporting data and research that informs current and future directions of the Medicare, Medicaid, and Children’s Health Insurance programs. The journal seeks to examine and evaluate health care coverage, quality and access to care for http://www.cms.gov/MMRR U.S. Department of Health & Human Services Kathleen Sebelius ecretary Centers for Medicare & Medicaid Services Marilyn Tavenner dministrator Editor-in-Chief David M. Bott, Ph.D. The complete list of Editorial Staff and Editorial Board members may be found on the MMRR Web site (click link): MMRR Editorial Staff Page Contact: mmrr-editors@cms.hhs.gov Published by the enters for Medicare & Medicaid Services. All material in the Medicare & Medicaid Research s in the public domain and may be duplicated without permission. Citation to source is requested. Introduction Changes in Medicare policies have affected the health care system in a variety of ways. Earlier reforms focused on payments, with attention recently shifting to quality of care. Medicare used pay-forperformance in the Premier Demonstration Project to encourage hospital reporting of process measures as a means of im

proving patient safety (Petersen et al., 2006). The Premier Demonstration Project was part of a value purchasing program initiated by Congress (Centers for Medicare & Medicaid Services, 2008), in response to reports by the Institute of Medicine about the preventability of some of the estimated 1.7 million U.S. hospital-acquired infections in and the resulting 100,000 deaths (Institute for Health Metrics, 2009; Scott, 2002). As part of the value purchasing program, edicare implemented a policy on October 1, 2008 that penalizes hospitals if Medicare patients acquire any of 8 conditions during their inpatient stay; i.e., if these infections were not present on admission. These conditions include catheter-associated urinary tract infections and vascular catheter-associated infections, two of three hospital-acquired infections that are either expensive to treat or commonly acquired. Under the new policy, hospitals would not be able to classify these conditions within a higher diagnosis related group (DRG) in order to receive additional reimbursement from Medicare (Institute for Health Metrics, 2009; Centers for Medicare & Medicaid Services, 2006). The Centers for Medicare & Medicaid Services (CMS) hopes that this policy will encourage hospitals to provide better quality of care by minimizing the rates of adverse events (Stone et alResearchers are divided over the likely impact f this policy on patient outcomes. McNutt et al Peasah, S. K., McKay, N. L., Harman, J. S., et al. 2013: Volume 3 (3) (2010), predict that the policy is likely to have a substantial impact on hospitals’ financial performance and hence impact their behavior. The study used administrative hospital discharge data from all patients in 86 academic medical centers across the U.S. between July 2005 and June 2007, to estimate the average amount of reimbursement loss per hospital based on Medicare non-payment policy requirements. Using simulations, the study found that about 4% of patients had at least one of the targeted eight hospital-acquired conditions, and estimated the average amount of reimbursement loss for the 86 hospitals at approximately $50 million per year (an average loss per case ranging from $1,548 to $7,310). McNair et al. (2009), on the other hand, suggested a lower impact, because of a lower predicted financial loss per hospital. The study based estimates on a simulation model using the California Office of State Health Planning and Development 2006 Patient Discharge Dataset. They estimated that the Medicare non-payment policy would result in a reimbursement loss in California hospitals each year between $92,000 and $227,000 (resulting in about $1.1 to 2.7 million nationally), substantially lower than what McNutt et al. (2010) estimated. Meddings et al(2010) agreed with McNa

ir that the expected impact will be minimal, due mainly to medical claims coding issues. Conceptually, the policy is structured to provide an incentive for hospitals to improve their infection control practices in order to avoid financial loss. Predictors of hospital-acquired infections include patient characteristics; for example, sex, age, co-morbidities like renal disease and immune-compromised conditions (Kaye , 2011; Greene et al., 2012), and hospital factors; for example, the type and duration of catheters left on a patient (Apisarnthanarak et al., 2007; Johnson, Kuskowski, & Wilt, 2006). These studies and others have shown that hospitals can reduce infection rates when they follow certain proven guidelines. For example, in the keystone project, following guidelines like hand hygiene, removing unnecessary catheters, and cleaning the skin with chlorhexidine led to a significant reduction in central-line blood infections, up to zero infections (Pronovost et al., 2006). Active surveillance and effective control measures were also found to be associated with lower infection rates (Haley ., 1980). Following these guidelines, however, may involve financial investments that are more costly than the predicted financial loss from the policy. Additional financial investments in infection control will, in turn, depend on the perceived financial strain of the policy on financial performance. In a survey of hospital CEOs regarding this policy, 70% planned to make financial investments by introducing new technologies to help improve infection rates (Pacemakerclub, 2012). Hospitals may improve outcomes due to the increased attention to patient safety brought about by the policy, and/ or from the perceived financial losses due to the policy. There are concerns, however, that the policy could result in unintended consequences, such as patient selection bias and overuse of antibiotics, which leads to antibiotic resistance (Burke, 2003). Although researchers have looked at the likely financial impact of the policy and unintended consequences, few have reported actual outcome data in relation to the policy’s implementation. The goal of this study is to evaluate, using both pre- and post-policy data, the association between Medicare’s non-payment policy and patient outcomes for hospital-acquired catheter-associated urinary tract infections (HA-CAUTI) and vascular catheter-associated infections (HA-VCAI). This study will contribute to our understanding of the possible effect of Medicare’s negative financial incentive on infection rates. Peasah, S. K., McKay, N. L., Harman, J. S., et al. 2013: Volume 3 (3) Methods This study uses trend analysis (interrupted time series) and a pre-post design with retrospective data to examine rates of HA-CAUTI and HA-VCAI per quarter, and before and after implementation of the Medicare policy in October,

2008 (Wagner, Soumarai, Zhang, & Ross-Degnan, (2002). We hypothesized that both the rates and the individual risk of HA-CAUTI and VCAI will be lower after implementation of the policy. Data The primary source of data was administrative hospital discharges maintained by the Florida Agency for Healthcare Administration (Agency for Health Care Administration, 2010) from 2007 to 2011. Florida is an ideal state to consider as it was one of the few states (others include California and New York) that required their hospitals to report whether infections were present on admission (POA) before the Medicare requirement (Wald & Kramer, 2007). We did not include data prior to 2006, because the POA indicator and VCAI coding became a requirement in 2007; the VCAI coding was reported from the fourth quarter of 2007. Therefore data used was from quarter 1, 2007 for CAUTI and quarter 4, 2007 for VCAI. Since 1988 AHCA has maintained a hospital discharge dataset with data on approximately two million patients per year. For this study, the dataset included 2,563,643 discharges in 2007, 2,571,688 in 2008, 2,491,033 in 2009, 2,604,090 in 2010, and 1,994,466 in the first three quarters of 2011. The dataset provided information on patient demographics, some hospital characteristics, and diagnosis codes. The study included all acute care hospitals, but excluded hospitals exempt from the policy, such as critical care hospitals, psychiatric hospitals, long-term care hospitals, and special hospitals like children and cancer care hospitals (McHugh, Martin, Orwat, & Van Dyke, 2011). Variables The first objective of the study is to compare the discharged diagnosis rates of the targeted hospital-acquired infections per quarter, and before and after Medicare implemented the policy. Secondly, the study estimates the odds of an individual patient acquiring these infections in the hospital post-policy, while controlling for other patient characteristics. Dependent Variables Among the eight conditions targeted by the policy are CAUTI and VCAI. Medicare specified ICD-9 codes and procedure codes necessary to identify these conditions, as well as a POA indicator to determine whether the condition was hospital-acquired, which is defined as a condition not present upon admission, but that presents after 48 hours in the hospital (ECRI Institute Special Advisory, 2008). For each discharge in the dataset, the presence or absence of CAUTI and VCAI were defined by ICD9 codes 996.64 and 999.31, respectively, and procedure codes 57.94 and 97.95. Then, each CAUTI and VCAI were further categorized as hospital-acquired or not based on the POA indicator (yes vs. no, or unknown). Independent variables The main independent variable, pre-or post-policy, was determined for each discharge based on whether the discharge date was between January 1, 2007 and September 30, 2008 (pre-policy) or between October 1, 2008 and September 30, 2011 (post-policy). Other covariates included the individual patient’s

age (continuous variable), race (White, Black, or Other), gender (male or female), Peasah, S. K., McKay, N. L., Harman, J. S., et al. 2013: Volume 3 (3) length of stay (continuous variable, we included only observations within standard deviations of the mean), insurance status of the patient (Medicare, Medicaid, Private, and other Government insurance like Tri-Care), and whether the patient required ICU care (yes or no). The specific hospital for each discharge was also identified. We tried other models that included hospital characteristics (e.g., ownership, size, nurse full-time equivalent (FTE) and the number of co-morbidities per patient, but they made no difference on the results. Analyses The analysis first determined the average quarterly discharge rates of any diagnosed CAUTI and VCAI as defined by the policy, and the proportion of all HA-CAUTI and HA-VCAI. The average rates of the proportion of HA-CAUTI/CAUTI and HA-VCAI/VCAI were compared pre- and post-policy implementation using an interrupted time series of the quarterly rates. The segmented regression analysis of interrupted time series, as described by Wager et al., is of the following form: × Time +  × Intervention +  × Time_after_Intervention + eis the outcome of interest (proportion of HA-CAUTI/CAUTI or HA-VCAI/VCAI per Time [in quarters]); represents the base trend; *OUFSWFOUJPOJTEVNNZ   UPEJTUJOHVJTIbetween pre-and post-policy eras; estimates the immediate change (change in level), due to the intervention; 5JNF@BęFS@*OUFSWFOUJPOJTJOUIFQSFQPMJDZera, and a continuous counting variable starting from 1 in the post-policy era; estimates the change in trend in the post-policy era; UIFJOUFSDFQUestimates the base level of the outcomes at the beginning of the series; and is the error term. Secondly, the analysis estimated the individual odds of being diagnosed with these infections (HA-CAUTI and HA-VCAI) post-policy, using a multivariate logistic regression in a generalized hierarchical linear model (GHLM). GHLM approach gives more robust results, because it factors in the clustering effect at the hospital level (Raudenbush & Bryk, 2002). The level-one covariates included individual patient race, age, type of insurance, gender, length of stay, and whether the patient required the intensive care unit. The level-two (cluster) variable was the specific hospital. Descriptive statistics For the sample used in the CAUTI model, mean patient age was about 71 years, 78% were White, and 60% were male. Medicare (including about 8% Medicare advantage admissions) was the most common primary source of payment (81%), with only 8% having private insurance. About 38% of the patients used the ICU and had an average length of stay of 10 days. The VCAI patients were younger on average (about 55 years old), lower proportion had Medicare as the primary source of payment (about 52%–55%), and much higher number compared to CAUTI patients had private insurance (abou

t 21%– 24%). Length of stay for VCAI patients was about 22 days and more than 50% used the ICU, indicating much sicker population (Exhibit 1). There were 204 and 210 hospitals with CAUTI and VCAI claims respectively, pre-policy, but there were 225 hospitals ith CAUTI and VCAI claims post-policy. Peasah, S. K., McKay, N. L., Harman, J. S., et al. 2013: Volume 3 (3) Descriptive Statistics of Patients with CAUTI and VCAI Pre-policy (2007Q1–2008Q3) and Post-policy CAUTI VCAI Pre-policy Post-policy Pre-policy Post-policy Category Description N = 5,510c N = 12,688c N = 6,119c N = 23,703c Percentage of admissions with infection 0.12% 0.16% 0.14% 0.30% Proportion of infection acquired in the 0.32 (0.47) 0.31 (0.46) 0.60 (0.49) 0.42 (0.49) hospital Age at admission 71.6 (16.6) 70.8 (17.0) 55.2 (22.3) 55.3 (21.5) Length of stay 10.0 (9.5) 9.7 (9.3) 23.4 (21.9) 19.7 (20.0) Proportion of males 0.60 (0.5) 0.60 (0.49) 0.49 (0.50) 0.49 (0.50) Proportion of blacks 0.14 (0.35) 0.16 (0.37) 0.21 (0.41) 0.25 (0.44) Proportion of whites 0.77 (0.42) 0.79 (0.41) 0.66 (0.48) 0.66 (0.48) Proportion of other race 0.08 (0.28) 0.05 (0.21) 0.13 (0.33) 0.09 (0.29) Proportion of Medicare / Medicare 0.81 (0.39) 0.81 (0.39) 0.52 (0.50) 0.55 (0.50) Advantage Proportion of Medicaid patients 0.07 (0.25) 0.08 (0.27) 0.16 (0.37) 0.18 (0.39) Proportion of commercial insurance 0.08 (0.28) 0.07 (0.25) 0.24 (0.43) 0.21 (0.41) patients Proportion other government insurance 0.02 (0.13) 0.02 (0.13) 0.03 (0.16) 0.02 (0.15) Proportion of self paying patients 0.01 (0.10) 0.01 (0.10) 0.03 (0.16) 0.02 (0.15) Proportion of other insurances 0.01 (0.11) 0.01 (0.10) 0.03 (0.16) 0.02 (0.13) Proportion using ICU 0.38 (0.49) 0.40 (0.49) 0.55 (0.50) 0.50 (0.50) Number of hospitals 204 225 210 225 NOTES: Catheter associated urinary-tract infections Vascular catheter associated infections Number of cases in dataset pre-or-post policy Standard Deviation. SOURCE: Author’s analysis. In Exhibit 2, the rate of CAUTI increased, but the rate of HA-CAUTI was almost the same over the years. The rate of VCAI increased until the end of 2009 and then decreased, but not to pre-policy levels; however, the rate of HA-VCAI post-policy decreased. In Exhibit 1, the percentage of CAUTI pre-policy was 0.12% and 0.16% post-policy; similarly, the percentage of VCAI pre-policy was 0.24% and 0.30% post-policy, suggesting that both infections increased over time. The proportion of hospital-acquired CAUTI (HA-CAUTI) was 0.32 pre-policy and 0.31 post-policy-suggesting that although infection rates increased, the proportion acquired in the hospital remained the same pre-post policy (Exhibit 3). The proportion of hospital-acquired VCAI (HA-VCAI) was 0.60 pre-policy and 0.45 post-policy, suggesting that although the proportion

of discharges with VCAI increased with time, the proportion of VCAI acquired in the hospital decreased (Exhibit 3). The interrupted time series analysis of the proportion of hospital-acquired CAUTI to all CAUTI discharges (Exhibit 4) confirm Exhibit 3) that the trend over time is insignificant (0.00036 p-value 0.9158), the change in slope Peasah, S. K., McKay, N. L., Harman, J. S., et al. Graph of Percentage of Cases of CAUTI, VCAI, HA-CAUTI (Hospital-Acquired) and HA-VCAI (Hospital-Acquired) Per Quarter           when policy was implemented HA-CAUTI CAUTI 0.15  2013: Volume 3 (3) SOURCE: Author’s analysis. Trend of the Proportion of Hospital-Acquired Infections to Discharges of All Respective Infections Per Quarter SOURCE: Author’s analysis. Peasah, S. K., McKay, N. L., Harman, J. S., et al. E7 2013: Volume 3 (3) due to the intervention is insignificant (0.00482 p-value 0.8132), and the slope post-policy (Time*Intervention) is also insignificant (–0.00447 p-value 0.2789). Similarly, the trend over time for analysis of the proportion of hospital-acquired VCAI to all VCAI discharges (Exhibit 4) confirm (Exhibit 3) that there was a significant decline over time (–0.01950 p-value 0.0481), and the change of slope due to the policy (Intervention) was significant (–0.06625 p-value 0.0372). However the change in policy over time (Time*Intervention) was not significant (0.00927 p-value 0.3363), suggesting that the initial decline in rate due to the policy has not been sustained over time. Exhibit 5 presents the odd ratios from the GHLM logistic regressions of HA-VCAI and HACAUTI models. The HA-VCAI Model The odds that a patient diagnosed with VCAI acquired in the hospital post-policy was reduced by 43% (OR = 0.57). Other covariates with statistical significance include age (an additional year increases the odds of VCAI by 1.3% OR = 1.013), length of stay (an additional day in the hospital increases your odds by 12% OR = 1.122), and race (Blacks have lower odds compared to Whites, OR = 0.843). Beneficiaries holding forms of insurance other han Medicare—private insurance (OR = 1.314), other government insurance (OR = 1.33), self pay (OR = 2.058), and other insurance (OR = 1.536)— had higher odds than Medicare patients to acquire VCAI in the hospital. Using the ICU increased the odds of patients acquiring VCAI in the hospital by 97% (OR = 1.966). The HA-CAUTI Model There was no statistically significant association between the timing of the policy and the odds of acquiring CAUTI in the hospital (OR = 0.968) post-policy. Results of the other covariates were similar to the VCAI model with some few exceptions: the odds ratio of males to females was 0.548, Medicaid patients were less likely than Medicare patient

s (OR = 0.824) to acquire CAUTI in the hospital, and there was no difference in the odds of acquiring CAUTI between Medicare patients and other government insurance holders. The hierarchical model analysis show a level 2 timate of 0.709 (S.E 0.082) for the VCAI model and 0.705 (S.E 0.103) for the CAUTI model. These estimates are more than twice their standard errors; therefore, some of the variability in the dependent variables is due to differences among hospitals. Interrupted Time Series Analysis of HA-CAUTI/CAUTI and HA-VCAI/VCAI Variable Estimate Standard Error T-Value P-Value Hospital-acquired CAUTI/CAUTI Intercept Effect over Time Post-Intervention Effect Immediate Intervention Effect Hospital-acquired VCAI/VCAI Intercept Effect over Time Post-Intervention Effect Immediate Intervention Effect SOURCE: Author’s analysis. Peasah, S. K., McKay, N. L., Harman, J. S., et al. E8 2013: Volume 3 (3) Odd ratios from the logistic regression of the hospital-acquired infections in acute care hospitals in Florida, 2007–2011 Variable Description HA-VCAI Model HA-CAUTI Model POLICY =1 from QTR4 2008 0.571*** 0.968 AGE Age at admission 1.013*** 1.010*** LOSDAYS Length of stay 1.122*** 1.143*** GENDER Proportion of males vs. females 1.052 0.548*** RACE Proportion of blacks vs. whites 0.831*** 0.775*** Other races vs. white 1.006 0.994 MEDICAID Medicaid holders vs. Medicare holders 1.045 0.824** PRIVATE Private insurance holders vs. Medicare 1.314*** 1.942*** holders GOVT Government insurance holders vs. 1.330*** 1.030 Medicare SELFPAY Self-payers vs. Medicare holders 2.058*** 2.083*** OTHINS Other insurance vs. Medicare holders 1.536*** 1.420 ICU Admitted to ICU vs. not in the ICU 1.966*** 2.089*** NOTES: *** means statistically significant at 1% ** means statistically significant at 5% SOURCE: Authors’ analyses. Discussion The goal of this study was to evaluate the association of Medicare non-payment policy on the probability of acquiring certain hospital-acquired infections. The hypothesis was that the policy would provide a strong enough financial incentive for most hospitals to reduce the probability of patients acquiring one of the infections in the post-policy period. The results of both the interrupted time series and the multivariate regression analysis suggest that there was a reduction in VCAI post-policy, but not CAUTI. The reduction in VCAI was substantial, suggesting that hospitals in Florida might have responded more strongly to the nonpayment policy for VCAI, which is more expensive to treat than CAUTI (CMS Proposed Rule, 2008). Thus, the perceived magnitude of the financial loss from a hospital-acquired condition may have influenced hospitals&

#146; attention and strategy towards infection control. Hartmann et al. (2012), in a qualitative study on 36 infection preventionists at nonfederal acute care hospitals, reported that there has been increased focus on these hospital-acquired infections and reported some evidence for increased urine analysis at admission since the policy. Central line-associated bloodstream infections (CLABSI), of which VCAI is a part, have received increased attention by not only the federal government, but also other healthcare organizations, such as The Joint Commission (TJC). For instance, the Agency for Healthcare Research and Quality (AHRQ), in collaboration with researchers from Johns Hopkins University, used the comprehensive unit-based safety program (CUSP) to achieve a 40% reduction in CLABSI in 44 states’ 1,100 intensive care units over 4 years (AHRQ, 2012), which could have contributed to the decline in VCAI (CUSP was started in 2003 in selected hospitals, but the project was extended to 10 states in 2008 and nationwide in 2009/2010, so it is difficult to predict the likely impact on VCAI independent of the policy). Additionally, hospital Peasah, S. K., McKay, N. L., Harman, J. S., et al. 2013: Volume 3 (3) infection rate reporting requirements in several states, including Florida, also could have contributed to the observed decline in VCAI post-policy. It is also possible that medical coders might have contributed to the reduction in cases, especially for VCAI, since VCAI are more expensive to treat. We explored this possibility by looking at the proportion of Medicare patients coded with POA = 0 (i.e., who acquired these infections in the hospital) over time. Since the policy targeted Medicare patients, the rationale is that hospital medical coders will have an incentive to pay increased attention to those patients. Results (not displayed) show that the decrease in the rate of Medicare patients with HA-VCAI was insignificant. Moreover, CMS, in collaboration with RTI and Clarity Coding, conducted research into the accuracy of the POA indicator for hospital-acquired conditions as reported by hospitals. In their report, published in June 2012, the researchers compared hospital MedPar claims and the corresponding medical reports, and found CAUTI POA coding was 94% accurate and VCAI POA coding was 97% accurate (Snow et al., 2012). This adds credence to the use of POA coding for our analysis and the limited role of code manipulation on the results. The concurrent interventions to reduce hospital-acquired infections, especially in CLABSI, suggest the degree of association we found could be overestimated. The findings that VCAI appeared to be more responsive to the policy than CAUTI, however, suggest

that the impact of the financial incentive, if any, may depend on its magnitude, as VCAI is relatively more expensive to treat. Thus, the specificity of the financial incentive may have contributed (Young, 2005); that is, Medicare was specific about the type of conditions covered by the policy and hospitals knew how much noncompliance with the policy would cost. Although the financial incentive might have affected different conditions differently and could be overestimated, because of concurrent interventions, the initial response is encouraging. And, as Medicare expands the non-payment policy to more hospital-acquired conditions, hospitals are more likely to continue to make changes that will positively affect patient outcomes. It is important to note some limitations of this study. The most important limitation is the lack of a non-policy control group that could have allowed a difference-in-difference analysis. It is possible that infection rates were declining over this period independent of the Medicare policy, but because there was no suitable control group of acute care hospitals that were not affected by this policy, it is not possible to determine this. Secondly, we were limited in the duration of pre-policy data, because there were no POA data prior to 2007 in Florida, and VCAI was a new requirement that was reported starting in the fourth quarter of 2007. Additionally, because this is an observational study, it is subject to all the limitations of non-randomized studies and, therefore, causality cannot be implied. Furthermore, the study was limited to Florida hospitals, nonetheless, it is one of the largest states in the U.S. and the data included a wide range of hospital types. We were unable to identify a national dataset that included information on whether infections were POA during the pre-policy period. In addition, the validity of the study is predicated on the accuracy of the DRG and the POA coding (Zhan et al., 2009). Some researchers have also expressed concern about adequacy of medical coding for research purposes, because, by law, medical coders can only code from information in the medical record documented by a provider (physicians, physician assistants, and nurse practitioners), which means nursing notes that might include information related to hospital-acquired infection will not be coded (Meddings et al., 2012). Because VCAI was a new requirement, there were no cases in the first 3 quarters of 2007 and there could have Peasah, S. K., McKay, N. L., Harman, J. S., et al. 2013: Volume 3 (3) been a learning curve for medical personnel in reporting cases. It is not known what impact that could have had on the results. However, even with these limitations, this study demonstrates that actual (as opposed to simulated) VCAI post-policy infection rates significantly declined in Florida. Our results are similar to what Lee et al. (2012) found: a significant re

duction in CLABSI, but they attributed the decline to other factors, because CLABSI was also declining before the policy was implemented. Additional research is warranted to further understand the underlying factors that led to the significant improvement in VCAI and the significant increase in rates for private insurance patients. In the future, when Medicare releases post-policy data at the national level, it will be possible to explore the organizational changes made by hospitals in order to better understand behavioral changes due to the policy. Correspondence Samuel Kwame Peasah, Ph.D., Mercer University. College of Pharmacy, 3001 Mercer University Dr., Atlanta, GA 30341-4155. Email Peasah_sk@mercer. edu, Tel. 678-547-6260, Fax. 678-547-6354. References Agency for Health Care Administration (2010). Retrieved from http:// www.floridahealthfinder. gov/Researchers/OrderData/order-data.aspx Agency for Healthcare Research and Quality (2012). Retrieved from http://www.ahrq.gov/ news/press/pr2012/pspclabsipr.htm Apisarnthanarak, A., Thongphubeth, K., Sirinvaravong, S., Kitkangvan, D., Yuekyen, C., Warachan, B., . . . Fraser, V. J. (2007). The Effectiveness of Multifaceted Hospital Wide Quality Improvement Programs Featuring an Intervention to Remove Unnecessary Urinary Catheters at a Tertiary Care Center in Thailand. Infection Control and Hospital Epidemiology, (7), 791–798. PubMed http://dx.doi. org/10.1086/518453 Burke, J. P. (2003). Infection control-A problem for patient safety. The New England Journal of Medicine, 348, 651–656 PubMed http://dx.doi. org/10.1056/NEJMhpr020557 Centers for Medicare & Medicaid Services (2006). Eliminating Serious, Preventable, and Costly Medical Errors-Never Events. Retrieved from http://w w w.cms.hhs.gov/apps/me dia/press/ release.asp?counter=1863 Centers for Medicare & Medicaid Services (2008). Roadmap for Implementing Value Driven Healthcare in the Traditional Medicare Fee-for-Service Program. Retrieved from h t t p://w w w.cm s.g o v/M e dic a r e/Q u a li ty- Initiatives-Patient-Assessment-Instruments/ Q u a li tyI ni t i a t i v esG enI nf o/do w n lo ad s/ vbproadmap_oea_1-16_508.pdf ECRI Institute Special Advisory (2008). List of CMS Hospital-Acquired Conditions Expanded under New Final Rule. Retrieved from https:// w w w.e cr i .o r g/D o c um ents/Pat ient_Sa f ety_ Center/CMS_New_Final_Rule.pdf CMS Proposed Rules, 73 Fed. Reg. 23528–23938 (proposed Apr. 30, 2008) (to be codified at 42 C.F.R. pt. 411, 412, 413, 422, 489. Retrieved from http://edocket.access.gpo.gov/2008/pdf/ 08-1135.pd Greene, M. T., Chang, R., Kuhn, L., Rogers, M. A., Chenoweth, C. E., Shuman, E., & Saint, S. (2012). Predictors of Hospital-Acquired Urinary Tract-Related Bloodstream Infection. nfection Control and Hospital Epidemiology, 33(10), 1001–1007. PubMed http://dx.doi.org/10.1086/667731 Peasah, S. K., McKay, N. L., Harman, J. S., et al. 2013: Volume 3 (3) Haley, R. W., Qu

ade, D., Freeman, H. E., & Bennett, J. V. (1980). Study on the Efficacy of Nosocomial Infection Control (SCENIC PROJECT): Summary of Study Design. American Journal of Epidemiology, 111 PubMed Hartmann, C. W., Hoff, T., Palmer, J. A., Wroe, P., Dutta-Linn, M. M., & Lee, G. (2012). The Medicare Policy of Payment Adjustment for Health Care Associated Infections: Perspectives on Potential Unintended Consequences. Medical Care Research and Review, 69(1), 45–61. PubMed http://dx.doi.org/10.1177/1077558711413606 Institute for Health Metrics (2009). CMS Reimbursement Rules for Hospital-Acquired Infections: How Electronic Reports Can Protect the Bottom Line. Retrieved from http://www. lif es ci en ce w r i t er.co m /G et t in g_ Ah e a d_o f _ Hospital_Acquired_Infection.pdf Johnson, J. R., Kuskowski, M. A., & Wilt, T. J. (2006). Systematic Review: Antimicrobial Urinary Catheters to Prevent Catheter-Associated Urinary Tract Infection in Hospitalized Patients. Annals of Internal Medicine, 144(2), 116–126. PubMed http://dx.doi.org/10.7326/0003-4819 144-2-200601170-00009 Kaye, K. S., Marchaim, D., Chen, T. Y., Chopra, T., Anderson, D. J., Choi, Y., & Schmader, K. E. (2011). Predictors of Nosocomial Bloodstream Infections in Older Adults. Journal of the American Geriatrics Society, 59(4), 622–627. PubMehttp:// dx.doi.org/10.1111/j.1532-5415.2010.03289. Lee, G. M., Kleinman, K., Soumerai, S. B., Tse, A., Cole, D., Fridkin, S. K., . . . Jha, A. K. (2012). Effect of Nonpayment for Preventable Infections in U.S. Hospitals. The New England Journal of Medicine, 367, 1428–1437. PubMed http:// dx.doi.org/10.1056/NEJMsa1202419 McHugh, M., Martin, T. C., Orwat, J., & Van Dyke, K. (2011). Medicare’s policy to Limit Payment for Hospital-Acquired Conditions: Impact on Safety Net Providers. Journal of Health Care for the Poor and Underserved, 22(2), 638–647. PubMed http://dx.doi.org/10.1353/hpu.2011.0058 McNair, P. D., Luft, H. S., & Bindman, A. B. (2009). Medicare’s Policy Not To Pay For Treating Hospital-Acquired Conditions: The Impact. Health Affairs, 28(5), 1485–1493. PubMed http://dx.doi.org/10.1377/hlthaff.28.5.1485 McNutt, R., Johnson, T. J., Odwazny, R., Remmich, Z., Skarupski, K., Meurer, S., . . . Harting, B. (2010). Change in MS-DRG Assignment and Hospital Reimbursement as a Result of Centers for Medicare & Medicaid Changes in Payment for Hospital-Acquired Conditions: Is it Coding or Quality? Quality Management in Health Care, PubMed Meddings, J., Saint, S., & McMahon, L., Jr. (2010, June). Hospital-Acquired Catheter-Associated Urinary Tract Infection: Documentation and Coding Issues May Reduce Financial Impact of Medicare’s New Payment Policy. Infection Control and Hospital Epidemiology, 31(6), 627– 633. PubMed http://dx.doi.org/10.1086/652523 Meddings, J. A., Reichert, H., Rogers, M. A., Saint, S., Stephansky, J., & McMahon, L. F. (2012). Effect of Non-Payment for Hospital-Acquired, Ca

theter-Associated Urinary Tract Infection: A Statewide Analysis. Annals of Internal Medicine, (5), 305–312. PubMed http://dx.doi.org/ 10.7326/0003-4819-157-5-201209040-00003 Pacemakerclub. (2012). Medicare Ruling Concerns Hospital CEOs. Retrieved from http://www. pacemakerclub.com/public/jpage/l/p/stor y/a/ Storypage/sid/25334/content.do Peasah, S. K., McKay, N. L., Harman, J. S., et al. MMRR Petersen, L. A., Woodard, L. D., Urech, T., Daw, C., & Sookanan, S. (2006). Does Pay-for-Performance Improve the Quality of Healthcare? Annals of Internal Medicine, 145(4), 265–272. PubMed http://dx.doi.org/10.7326/0003-4819 145-4-200608150-00006 Pronovost, P., Needham, D., Berenholtz, S., Sinopoli, D., Chu, H., Cosgrove, S., . . . Goeschel, C. (2006). An Intervention to Decrease Catheter-Related Bloodstream Infections in the ICU. The New England Journal of Medicine, 355 PubMed http://dx.doi.org/10.1056/ NEJMoa061115 Raudenbush, S., & Bryk, A. (2002). Hierarchical Linear Models: Applications and Data Analysis Methods, London: Sage Publications. Scott, R. D. (2002). The Direct Medical Cost of Healthcare-Associated Infections in U.S. Hospitals and the Benefits of Prevention.CDC Division of Healthcare Quality Promotion. Retrieved from http://www.cdc.gov/ncidod/ dhqp/pdf/scott_costpaper.pdf Snow, C. L., Holtzman, L., Waters, H., McCall, N. T., Halpern, M., & Newman, L. … Guzman, C. R. (2012). Accuracy of Coding in the Hospital-Acquired Conditions Present on Admission Program Final Report. Retrieved from http://www. cms.gov/Medicare/Medicare-Fee-for-Service- P a y m en t/H os p i t a lA cqC o n d/D o w n lo ad s/ Accuracy-of-Coding-Final-Report.pd 2013: Volume 3 (3) Stone, P. W., Gilead, S., McNair, P., Mattes, N., Cohen, B., Landers, T., & Larson, E. (2010). CMS Changes in Reimbursement for HAIs: Setting a Research Agenda. Medical Care, 48 PubMed http://dx.doi.org/10.1097/ MLR.0b013e3181d5fb3f Wagner, A. K., Soumarai, S. B., Zhang, F., & Ross-Degnan, D. (2002). Segmented Regression Analysis of Interrupted Time Series Studies in Medication Use Research. Journal of Clinical Pharmacy and Therapeutics, 27(4), 299–309. PubMed http://dx.doi.org/10.1046/j.1365 2710.2002.00430.x Wald, H. L., & Kramer, A. M. (2007). Nonpayment for Harms Resulting from Medical Care. Journal of the American Medical Association, 298 PubMed http://dx.doi.org/10.1001/ jama.298.23.2782 Young, G. J. (2005). Conceptual Issues in the Design and Implementation of Pay-for-Quality Programs. American Journal of Medical Quality, 20(3), 144–150. PubMed http://dx.doi. org/10.1177/1062860605275222 Zhan, C., Elixhauser, A., Richards, C. L., Jr., Wang, Y., Baine, W. B., Pineau, M., . . . Hunt, D. (2009). Identification of Hospital-Acquired Catheter-Associated Urinary Tract Infections from Medicare Claims. Medical Care, 47 PubMed http://dx.doi.org/10.1097/ MLR.0b013e31818af83d Peasah, S. K., McKay, N. L., Harman, J. S