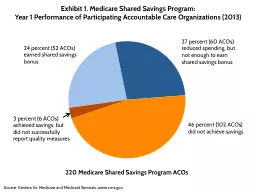
Year 1 Performance of Participating Accountable Care Organizations 2013 Source Centers for Medicare and Medicaid Services wwwcmsgov 220 Medicare Shared Savings Program ACOs Exhibit 2 Percentage of Accountable Care Organizations in the ID: 476967
Download Presentation The PPT/PDF document "Exhibit 1. Medicare Shared Savings Progr..." is the property of its rightful owner. Permission is granted to download and print the materials on this web site for personal, non-commercial use only, and to display it on your personal computer provided you do not modify the materials and that you retain all copyright notices contained in the materials. By downloading content from our website, you accept the terms of this agreement.
Slide1
Exhibit 1. Medicare Shared Savings Program: Year 1 Performance of Participating Accountable Care Organizations (2013)
Source: Centers for Medicare and Medicaid Services, www.cms.gov.
220 Medicare Shared Savings Program ACOsSlide2
Exhibit 2. Percentage of Accountable Care Organizations in the Medicare Shared Savings Program Meeting Select Quality Benchmarks (2013)
Notes: Benchmarks are set based on the performance of Medicare providers not participating in the Shared Savings Program.
ACS = ambulatory care–sensitive.
Source: Centers for Medicare and Medicaid Services,
https://
data.cms.gov/ACO/Medicare-Shared-Savings-Program-Accountable-Care-O/yuq5-65xt
.Slide3
Exhibit 3. Select CMS Innovation Center Initiatives on Primary Care Transformation
Comprehensive
Primary Care
Initiative
Multi-Payer
Advanced Primary Care Practice Demonstration
FQHC Medical Home Demonstration
Independence
at
Home
Total
Patients
2,534,506
2,225,537
Total
n/a;
207,000
Medicare beneficiaries
8,300
4,768,343
Providers
2,494
3,837
2,700
347
9,378
Multiple
payers?
Yes
Yes
No
No
2/4 initiatives
Total payments
to
date
$
153.2M
$99.2M
$41.7M
Have not
issued
payments
$
294.1M
Early results
In
year 1, initiative generated nearly enough savings to cover
$20 care management fee paid, although not enough for net savings. Across all seven regions, emergency department visits decreased by 3% and hospital admissions by 2%.
Quality results mixed.
Generated $4.5 million in savings across eight states.
73% of 492 participating health centers achieved Level 3 Patient-Centered
Medical Home recognition based on standards set by National Committee for Quality Assurance, short of 90% goal set in 2011.
No results yet
Slide4
Source
: Patrick Conway, Office
of Information Products and Data Analytics,
Centers for Medicare and Medicaid Services.
Exhibit
4
. Change in All-Cause 30-Day
Hospital Readmission
Rates
PercentSlide5
Exhibit 5. Accelerating Implementation of Key Payment Reform Provisions
Hospital
Value-Based Purchasing
2010–2012
2013
2014–2017
Medicare Shared Savings Program
1
2012–13
2014–15
2016 and beyond
Hospital Readmissions Reduction Program
2010–12
2013
2014–15
1
Builds on Physician Group Practice demonstration. Pioneer and Advanced Payment ACOs also launched through the Center for Medicare and Medicaid Innovation in 2012 with more-sophisticated provider organizations.Slide6
Exhibit 6. CMS Innovation Center’s Focus Areas and Selected Initiatives
Accountable Care
Pioneer ACOs
Advance Payment ACOs
Bundled Payment for Care Improvement
Model 1: Retrospective Acute Care
Model 2: Retrospective Acute and
Postacute
Care Episode
Model 3: Retrospective Postacute Care
Model 4: Prospective Acute CarePrimary Care TransformationComprehensive Primary Care Initiative
Advanced
Primary Care Practice
Demonstration (Federally Qualified
Health Centers)
Independence
at Home
Demonstration
Multi-Payer Advanced Primary Care Practice Demonstration
Initiatives to Speed the Adoption of Best Practices
Innovation Advisors Program
Partnership for Patients
Initiatives Focused on the Medicaid and CHIP Population
Medicaid Emergency Psychiatric Demonstration
Medicaid Innovation Accelerator Program
Strong Start for Mothers and Newborns
Medicaid Incentives for Prevention of Chronic Diseases
Initiatives Focused on Medicare-Medicaid Enrollees
Financial Alignment Initiative
Initiative to Reduce Avoidable Hospitalization Among Nursing Facility Residents
Initiatives to Accelerate the Development and Testing of New Payment and Service Delivery Models
Health Care Innovation Awards
State Innovation Models InitiativeSlide7
Exhibit 7. Change in Rates for Hospital-Acquired Conditions, 2010–13
Source: Agency for Healthcare Research and Quality,
Efforts to Improve Patient Safety Result in 1.3 Million Fewer Patient Harms: Interim Update on 2013 Annual Hospital-Acquired Condition Rate and Estimates of Cost Savings and Deaths Averted from 2010 to 2013,
Dec. 2014.