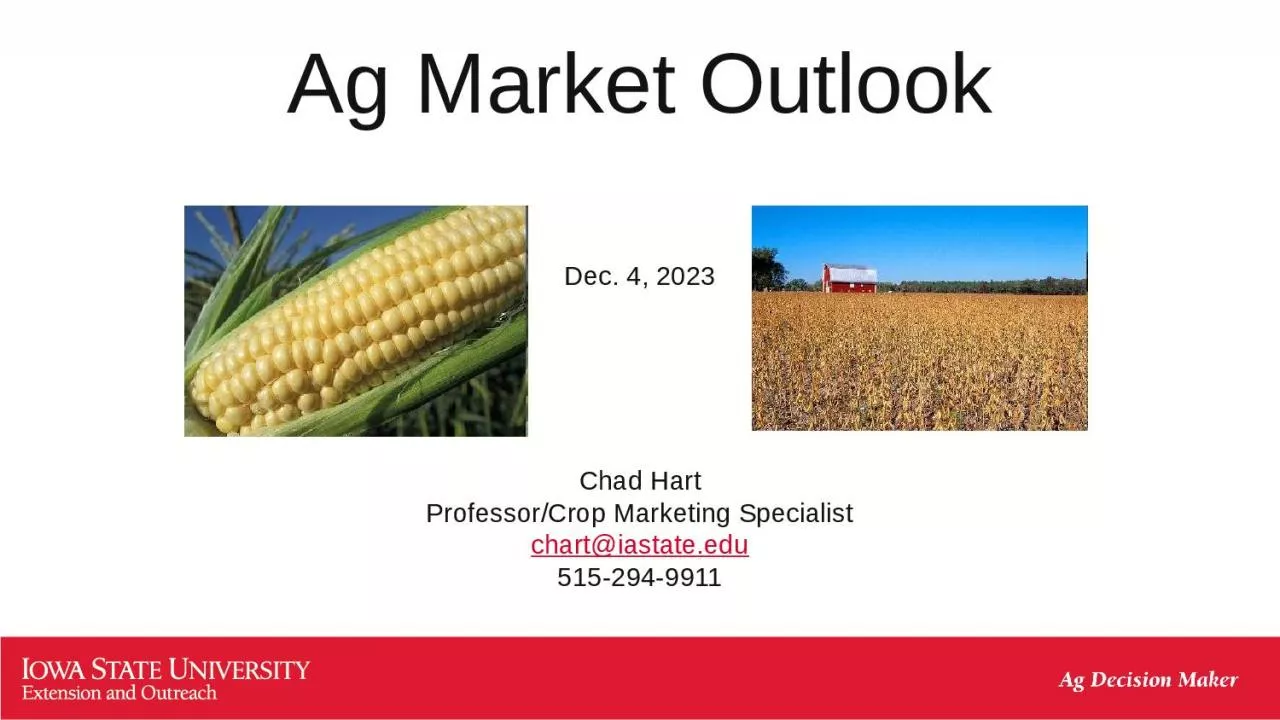
Chad Hart ProfessorCrop Marketing Specialist chartiastateedu 5152949911 US Corn Supply and Use Marketing Year 2023 9123 to 83124 2020 2021 2022 2023 2024 Area Planted mil acres ID: 1047723
Download Presentation The PPT/PDF document "Ag Market Outlook Dec. 4, 2023" is the property of its rightful owner. Permission is granted to download and print the materials on this web site for personal, non-commercial use only, and to display it on your personal computer provided you do not modify the materials and that you retain all copyright notices contained in the materials. By downloading content from our website, you accept the terms of this agreement.
1. Ag Market OutlookDec. 4, 2023Chad HartProfessor/Crop Marketing Specialistchart@iastate.edu515-294-9911
2. U.S. Corn Supply and UseMarketing Year (2023 = 9/1/23 to 8/31/24)20202021202220232024Area Planted(mil. acres)90.793.388.694.991.0Yield(bu./acre)171.4176.7173.4174.9181.0Production(mil. bu.)14,11115,07413,71515,23415,040Beg. Stocks(mil. bu.)1,9191,2351,3771,3612,156Imports(mil. bu.)2424392525Total Supply(mil. bu.)16,05516,33315,13016,62117,221Feed & Residual(mil. bu.)5,6075,7215,5495,6505,800Ethanol(mil. bu.)5,0285,3265,1765,3255,300Food, Seed, & Other(mil. bu.)1,4391,4381,3821,4151,410Exports(mil. bu.)2,7472,4711,6612,0752,050Total Use(mil. bu.)14,82114,95613,76914,46514,560Ending Stocks(mil. bu.)1,2351,3771,3612,1562,661Season-Average Price($/bu.)4.536.006.544.854.50Sources: USDA-WAOB and USDA-OCE
3. U.S. Soybean Supply and UseMarketing Year (2023 = 9/1/23 to 8/31/24)20202021202220232024Area Planted(mil. acres)83.487.287.583.687.0Yield(bu./acre)51.051.749.649.952.0Production(mil. bu.)4,2164,4654,2704,1294,475Beg. Stocks(mil. bu.)525257274268245Imports(mil. bu.)2016253015Total Supply(mil. bu.)4,7614,7384,5694,4284,735Crush(mil. bu.)2,1412,2042,2122,3002,375Seed & Residual(mil. bu.)9710297127123Exports(mil. bu.)2,2662,1581,9921,7551,925Total Use(mil. bu.)4,5044,4644,3014,1824,423Ending Stocks(mil. bu.)257274268245311Season-Average Price($/bu.)10.8013.3014.2012.9011.30Sources: USDA-WAOB and USDA-OCE
4.
5. Source: NOAA CPC
6. U.S. Corn Yield EstimatesSource: USDA-NASSTop: 2023 yield estimateBottom: % change from last year
7. U.S. Soybean Yield EstimatesSource: USDA-NASSTop: 2023 yield estimateBottom: % change from last year
8. World Corn ProductionSource: USDA-WAOB
9. World Soybean ProductionSource: USDA-WAOB
10. South American WeatherSource: USDA-WWCB
11. Global Arable Land
12. Soybean Export SalesSource: USDA-FAS
13. Soybean Export ShiftsSource: USDA-FAS
14. Soybean Export ComparisonSource: USDA-FASOld CropNew Crop
15. Corn Export SalesSource: USDA-FAS
16. Corn Export ShiftsSource: USDA-FAS
17. Corn Export ComparisonSource: USDA-FASOld CropNew Crop
18. U.S. Meat Production & PricesSource: USDA-WAOB
19. Pork Export SalesSource: USDA-FAS
20. Pork Export ShiftsSource: USDA-FAS
21. Beef Export SalesSource: USDA-FAS
22. Beef Export ShiftsSource: USDA-FAS
23. Corn Grind for Ethanol
24. Soy Crushing CapacitySource: ASA
25. Sources: S&P Global Platts and EIA
26. U.S. Soybean Oil Supply and UseMarketing Year (2023 = 10/1/23 to 9/31/24)20202021202220232024Production(mil. lb.)25,02326,15526,22727,02527,925Beg. Stocks(mil. lb.)1,8532,1311,9911,6021,577Imports(mil. lb.)302303376400425Total Supply(mil. lb.)27,17728,58928,61429,02729,927Biofuel(mil. lb.)8,92010,37912,40012,80013,600Food, Feed & Other(mil. lb.)14,39414,44914,21414,30014,400Exports(mil. lb.)1,7311,771378350350Total Use(mil. lb.)25,04626,59826,99227,45028,350Ending Stocks(mil. lb.)2,1311,9911,6021,5771,577Average Price(¢/lb.)56.8772.9865.2661.0055.00Source: USDA-WAOB
27. U.S. Soybean Meal Supply and UseMarketing Year (2023 = 10/1/23 to 9/31/24)20202021202220232024Production(1,000 tons)50,56551,81452,49354,15455,875Beg. Stocks(1,000 tons)341341311371400Imports(1,000 tons)784655632600600Total Supply(1,000 tons)51,69152,81053,43655,12556,875Domestic Disappearance(1,000 tons)37,67438,95938,40239,42540,325Exports(1,000 tons)13,67513,54014,66415,30016,150Total Use(1,000 tons)51,35052,49953,06554,72556,475Ending Stocks(1,000 tons)341311371400400Average Price($/ton)392.31439.81451.91380.00330.00Source: USDA-WAOB
28. Current Corn FuturesSource: CME Group, 12/1/20234.785.04
29. 12.9712.48Current Soybean FuturesSource: CME Group, 12/1/2023
30. 2022/23 Crop Price ProjectionsBased on futures prices
31. 2023/24 Crop Price ProjectionsBased on futures prices
32. Thank you for your time!Any questions?My web site:https://faculty.sites.iastate.edu/chart/Ag Decision Maker:http://www.extension.iastate.edu/agdm/
33. Iowa State University is an equal opportunity provider. For the full non-discrimination statement or accommodation inquiries, go to www.extension.iastate.edu/diversity/ext.Iowa State University ofrece igualdad de oportunidades. Para ver la declaración completa de no discriminación o para consultas de acomodación, siga a este vinculo:www.extension.iastate.edu/diversity/ext.