/
Nixu Corporation Nixu Corporation

Nixu Corporation - PDF document

madison
madison . @madison
Follow
346 views
Uploaded On 2021-06-20

Nixu Corporation - PPT Presentation

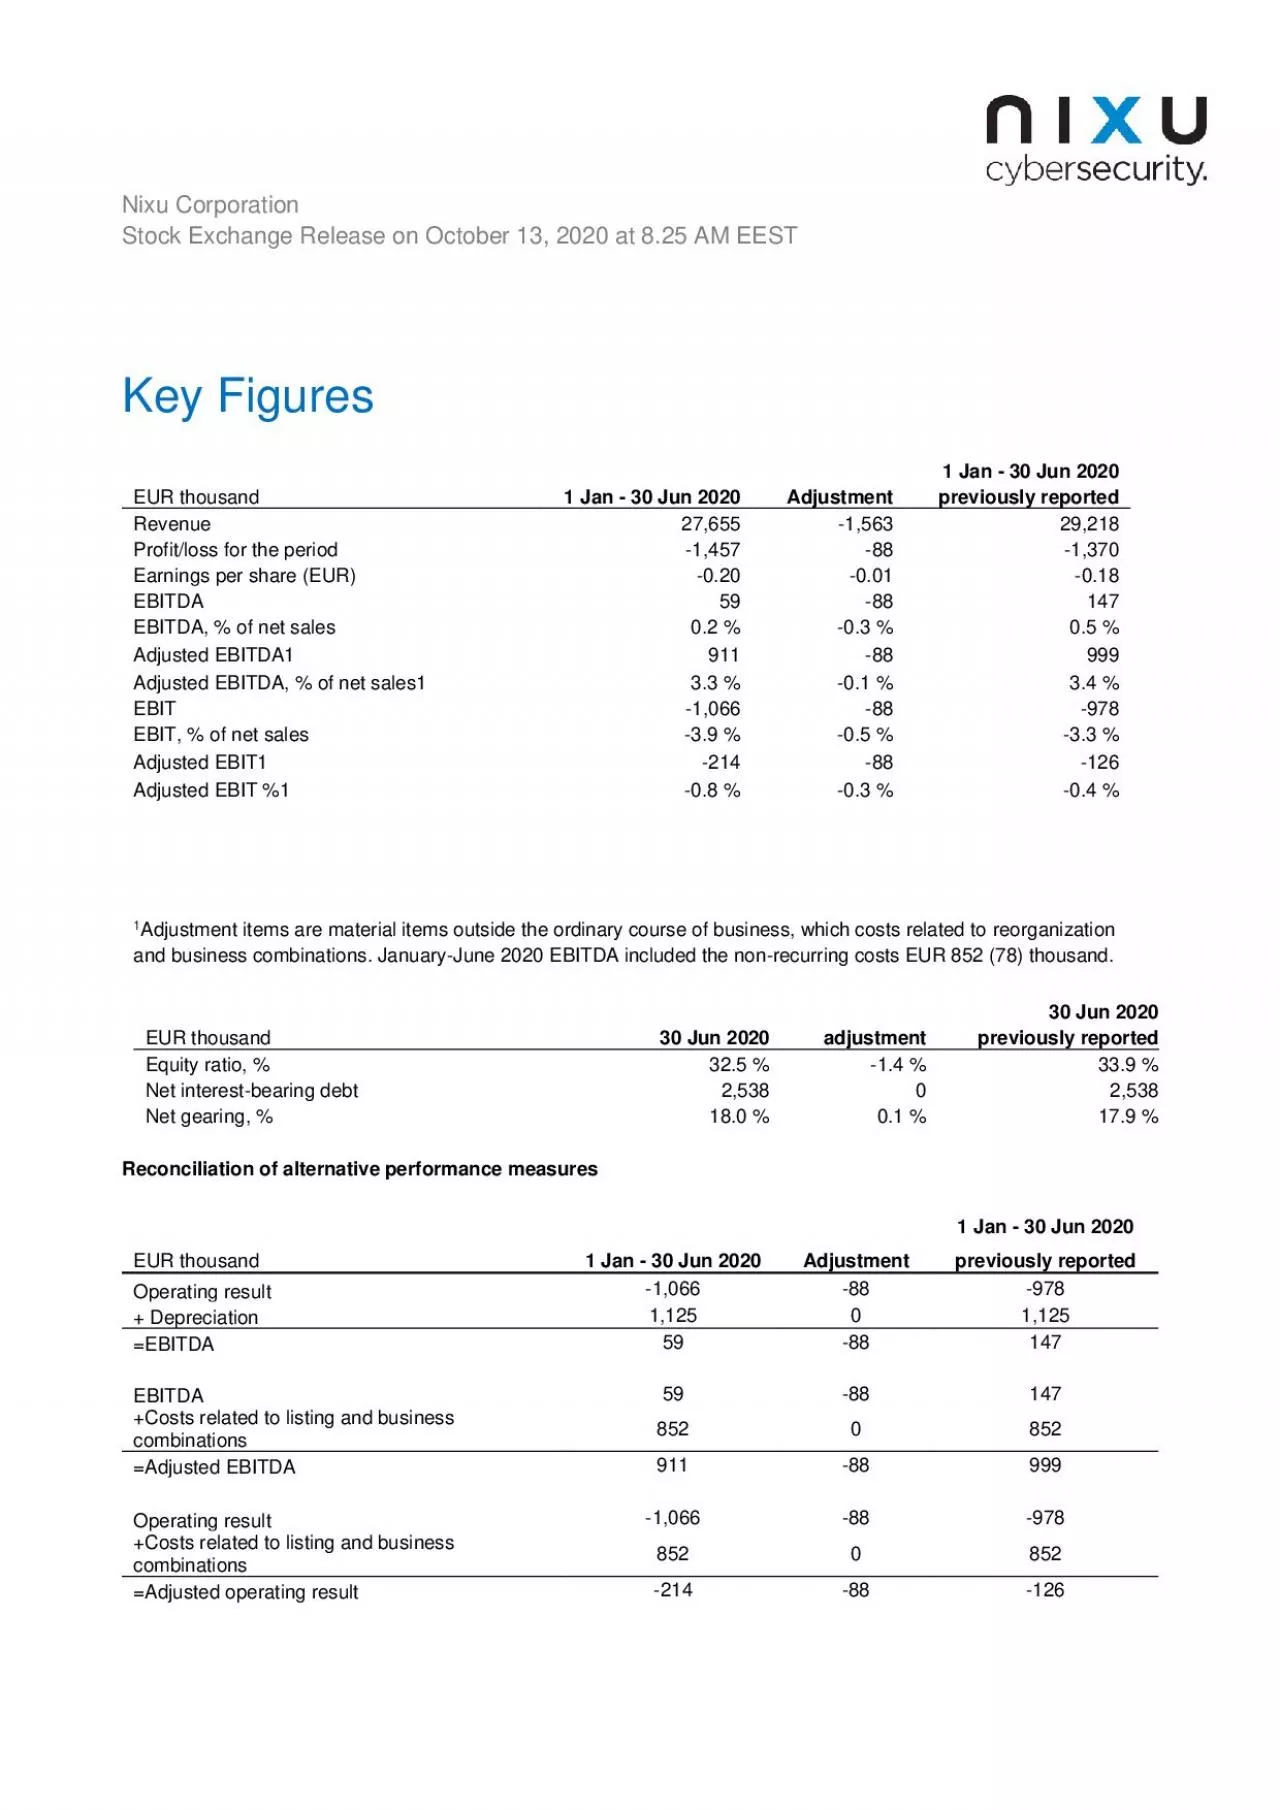
1 Stock Exchange R elease on October 13 2020 at 8 25 AM EEST Key Figures 1 Jan 30 Jun 2020 EUR thousand 1 Jan 30 Jun 2020 Adjustment previously reported Revenue 27655 1563 29218 Profi ID: 846251

income 2020 jun total 2020 income total jun period cash equity jan net liabilities result eur current adjustment assets

Share:

Link:

Embed:

Download Presentation from below link

Download Pdf The PPT/PDF document "Nixu Corporation" is the property of its rightful owner. Permission is granted to download and print the materials on this web site for personal, non-commercial use only, and to display it on your personal computer provided you do not modify the materials and that you retain all copyright notices contained in the materials. By downloading content from our website, you accept the terms of this agreement.


Presentation Transcript

1 1 Nixu Corporation Stock Exchange
1 Nixu Corporation Stock Exchange R elease on October 13, 2020 at 8 . 25 AM EEST Key Figures 1 Jan - 30 Jun 2020 EUR thousand 1 Jan - 30 Jun 2020 Adjustment previously reported Revenue 27,655 - 1,563 29,218 Profit/loss for the period - 1,457 - 88 - 1,370 Earnings per share (EUR) - 0.20 - 0.01 - 0.18 EBITDA 59 - 88 147 EBITDA, % of net sales 0.2 % - 0.3 % 0.5 % Adjusted EBITDA1 911 - 88 999 Adjusted EBITDA, % of net sales1 3.3 % - 0.1 % 3.4 % EBIT - 1,066 - 88 - 978 EBIT, % of net sales - 3.9 % - 0.5 % - 3.3 % Adjusted EBIT1 - 214 - 88 - 126 Adjusted EBIT %1 - 0.8 % - 0.3 % - 0.4 % 1 Adjustment items are material items outside the ordinary course of business, which costs related to reorganization and business combinations . January - June 20 20 EBITDA included the non - recurring costs EUR 852 ( 78 ) thousand. 30 Jun 2020 EUR thousand 30 Jun 2020 adjustment previously reported Equity ratio, % 32.5 % - 1.4 % 33.9 % Net interest - bearing debt 2,538 0 2,538 Net gearing, % 18.0 % 0.1 % 17.9 % Reconciliation of alternative performance measures 1 Jan - 30 Jun 2020 EUR thousand 1 Jan - 30 Jun 2020 Adjustment previously reported Operating result - 1,066 - 88 - 978 + Depreciation 1,125 0 1,125 =EBITDA 59 - 88 147 EBITDA 59 - 88 147 +Costs related to listing and business combinations 852 0 852 =Adjusted EBITDA 911 - 88 999 Operating result - 1,066 - 88 - 978 +Costs related to listing and business combinations 852 0 852 =Adjusted operating result - 214 - 88 - 126 2 Consolidated Statement of Compreh

2 ensive Income EUR thousand
ensive Income EUR thousand 1 Jan - 30 Jun 2020 1 Jan - 30 Jun 2020 Adjustment previously reported Revenue 27,655 - 1,563 29,218 Other operating income 296 0 296 Materials and services - 6,547 1,475 - 8,022 Employee benefit expenses - 18,255 0 - 18,255 Other operating expenses - 3,090 0 - 3,090 Depreciation and amortization - 1,125 0 - 1,125 Impairment charges 0 0 0 Operating result - 1,066 - 88 - 978 Finance income 4 0 4 Finance expenses - 289 0 - 289 Interest expenses on lease payments - 57 0 - 57 Finance income and expenses, net - 342 0 - 342 Result before taxes - 1,407 - 88 - 1,319 Income tax expense - 50 0 - 50 Result for the period - 1,457 - 88 - 1,370 Other comprehensive income Items that may be reclassified to profit or loss: Translation differences - 12 0 - 12 Other comprehensive income for the period, net of tax - 12 0 - 12 Total comprehensive income for the period - 1,469 - 88 - 1,381 Result for the period attributable to: Owners of the parent - 1,457 - 88 - 1,370 Result for the period - 1,457 - 88 - 1,370 Total comprehensive income for the period attributable to: Owners of the parent - 1,469 - 88 - 1,381 Total comprehensive income - 1,469 - 88 - 1,381 Earnings per share for profit attributable to the owners of the parent during the year Basic and diluted earnings per share, EUR - 0.20 - 0.01 - 0.18 3 Consolidated Statement of Financial Position EUR thousand 30 Jun 2020

3 30 Jun 2020 adjustment previousl
30 Jun 2020 adjustment previously reported ASSETS Non - current assets Goodwill 13,909 0 13,909 Other intangible assets 2,675 0 2,675 Property, plant and equipment 448 0 448 Right - of - use assets 3,042 0 3,042 Other receivables 253 0 253 Deferred tax assets 0 0 0 Total non - current assets 20,327 0 20,327 Current assets Inventories 4 0 4 Trade receivables and other receivables 15,158 1,478 13,681 Current income tax receivables 153 0 153 Cash and cash equivalents 7,662 0 7,662 Total current assets 22,978 1,478 21,500 Total assets 43,305 1,478 41,827 EQUITY AND LIABILITIES Equity Share capital 95 0 95 Invested unrestricted equity reserve 19,314 0 19,314 Translation differences - 599 0 - 599 Retained earnings - 3,273 0 - 3,273 Result for the period - 1,457 - 88 - 1,370 Total equity attributable to owners of the parent 14,079 - 88 14,167 Liabilities Non - current liabilities Borrowings 5,279 0 5,279 Lease liabilities 1,827 0 1,827 Deferred tax liabilities 180 0 180 Other non - current liabilities 251 0 251 Total non - current liabilities 7,537 0 7,537 Current liabilities Borrowings 1,727 0 1,727 Lease liabilities 1,367 0 1,367 Trade payables and other payables 18,328 1,566 16,762 Current income tax liabilities 266 0 266 Total current liabilities 21,689 1,566 20,123 Total liabilities 29,226 1,566 27,660 Total equity and liabilities 43,305 1,478 41,827

4 4 Consolidated Statement of C ash F
4 Consolidated Statement of C ash F lows EUR thousand 1 Jan - 30 Jun 2020 1 Jan - 30 Jun 2020 Adjustment previously reported Cash flows from operating activities Result for the period - 1,457 - 88 - 1,370 Adjustments for: 0 Depreciation and amortization 1,125 0 1,125 Other non - cash adjustments 252 0 252 Finance income and expenses, net 342 0 342 Income tax expense 50 0 50 Changes in working capital 0 Change in trade receivables and other receivables 877 - 1,478 2,355 Change in inventories 0 0 0 Change in trade payables and other payables 3,922 1,565 2,357 Interests paid - 160 0 - 160 Interests received 4 0 4 Other finance income and expenses, net - 76 0 - 76 Income taxes paid - 121 0 - 121 Net cash flows generated from operating activities 4,759 0 4,759 Cash flows from investing activities Purchases of tangible assets - 33 0 - 33 Purchases of intangible assets - 64 0 - 64 Payments for business acquisitions , net of cash acquired 0 0 0 Loans granted 0 0 0 Proceeds from loans receivable 202 0 202 Net cash from investing activities 105 0 105 Cash flows from financing activities Proceeds from issues of shares and other equity securities 0 0 0 Proceeds from borrowings 0 0 0 Repayments of borrowings - 348 0 - 348 Lease liability repayments - 784 0 - 784 Net cash from financing activities - 1,133 0 - 1,133 Net decrease ( - ) / increase in cash and cash equivalents 3,731 0 3,731 Cash and cash equivalents at the beginning of the period 3,923 0 3,923 Exchange gains / loss

5 es ( - ) on cash and cash equivalents
es ( - ) on cash and cash equivalents 8 0 8 Cash and cash equivalents at the end of period 7,662 0 7,662 5 Consolidated Statement of Changes in Equity Attributable to owners of the parent EUR thousand Share capital Invested unrestricted equity reserve Cumulative translation difference Retained earnings Total equity Equity at 1 Jan 2019 95 17,285 - 441 - 119 16,820 Result for the period 488 488 Other comprehensive income for the period: Translation differences - 190 - 190 Total comprehensive income for the period 0 0 - 190 488 298 Transactions with owners: Issue of shares as consideration for a business combination 900 900 Share issue related to 2019 share - based compensation 1,128 1,128 Share based payments to employees 20 20 Total transactions with owners: 0 2,029 0 20 2,049 Equity at 30 Jun 2019 95 19,314 - 632 390 19,167 Equity at 1 Jan 2020 95 19,314 - 587 - 3,436 15,385 Result for the period - 1,370 - 1,370 Adjustment - 88 - 88 Result for the period (previously reported) - 1,457 - 1,457 Other comprehensive income for the period: Translation differences - 12 - 12 Total comprehensive income for the period 0 0 - 12 - 1,457 - 1,469 Transactions with owners: Share based payments to employees 163 163 Total transactions with owners: 0 0 0 163 163

6 Equity at 30 Jun 2
Equity at 30 Jun 2020 (previously reported) 95 19,314 - 599 - 4,643 14,167 Adjustment - 88 - 88 Equity at 30 Jun 2020 95 19,314 - 599 - 4,731 14,079 6 Revenue Breakdown by Service Area: 1 Jan - 30 Jun 2020 EUR thousand 1 Jan - 30 Jun 2020 Adjustment previously reported Service type: Projects and assignments 13,964 0 13,964 Total continuous services 10,077 0 10,077 Managed services 5,223 0 5,223 Continuous services 4,854 0 4,854 Technology resell 3,614 - 1,563 5,178 Total 27,655 - 1,563 29,218 Revenue by Geographical Area 1 Jan - 30 Jun 2020 EUR thousand 1 Jan - 30 Jun 2020 Adjustment previously reported Finland 16,057 0 16,057 Denmark 4,460 - 1,563 6,023 Sweden 4,820 0 4,820 The Netherlands 582 0 582 Norway 565 0 565 Belgium 484 0 484 Other 687 0 687 Total 27,655 - 1,563 29,218 Further information: CEO Petri Kairinen, Nixu Corporation Telephone: +358 40 832 1832, e - mail: petri.kairinen@nixu.com Distribution: Nasdaq Helsinki Main media www.nixu.com Nixu in Brief: Nixu is a cybersecurity services company on a mission to keep the digital society running. Our pass ion is to help organizations embrace digitalization securely. Partnering with our clients we provide practical solutions for ensuring business continuity, an easy access to digital services and data protection. We aim to provide the best workplace to our t eam of over 400 cybersecurity professionals with a hands - on attitude. With Nordic roots we serve enterprise clients worldwide. Nixu shares are listed on the Nasdaq Helsinki stock exchange. www.nixu.c