/
 A MEANS TO CLOSING GAPS  DISAGGREGATED HUMAN DEVELOPMENT INDEX  A MEANS TO CLOSING GAPS  DISAGGREGATED HUMAN DEVELOPMENT INDEX

A MEANS TO CLOSING GAPS DISAGGREGATED HUMAN DEVELOPMENT INDEX - PDF document

marina-yarberry
marina-yarberry . @marina-yarberry
Follow
414 views
Uploaded On 2017-04-11

A MEANS TO CLOSING GAPS DISAGGREGATED HUMAN DEVELOPMENT INDEX - PPT Presentation

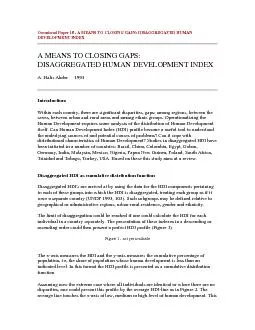
A MEANS TO CLOSING GAPS DISAGGREGATED HUMAN DEVELOPMENT INDEX A Halis Akder 1994 IntroductionWithin each country there are significant disparities gaps among regions between the nd ID: 338831

MEANS CLOSING GAPS:

Share:

Link:

Embed:

Download Presentation from below link

Download Pdf The PPT/PDF document " A MEANS TO CLOSING GAPS DISAGGREGATED ..." is the property of its rightful owner. Permission is granted to download and print the materials on this web site for personal, non-commercial use only, and to display it on your personal computer provided you do not modify the materials and that you retain all copyright notices contained in the materials. By downloading content from our website, you accept the terms of this agreement.


Presentation Transcript

Occasional Paper 18 - A MEANS TO CLOSING GAPS: DISAGGREGATED HUMAN DEVELOPMENT INDEX A MEANS TO CLOSING GAPS: DISAGGREGATED HUMAN DEVELOPMENT INDEX A. Halis Akder 1994 Introduction:Within each country, there are significant disparities, gaps: among regions, between the nd among ethnic groups. Operationalizing the Human Development requires some analysis of the distribution of Human Development itself. Can Human Development Index (HDI) profile become a useful tool to understand the underlying sources of and potential causes of problems? Can it cope with pment? Studies in disaggregated HDI have been initiated in a number of countries: Brazil, China, Colombia, Egypt, Gabon, Germany, India, Malaysia, Mexico, Nigeria,these this study aims at a review. Disaggregated HDI as cumulative distribution functionDisaggregated HDI's are arrived at by using the data for the HDI components pertaining to each of these groups into which the HDI is disaggregated, treating each group as if it ch subgroups may be defined relative to geographical or administrative regions, urThe limit of disaggregation could be reached if one could calculate the HDI for each perfect HDI profile (Figure 1). Figure 1 - not yet availableThe x-axis measures the HDI and the y-axis measures the cumulative percentage of e human development is less than an indicated level. In this format the HDI profile is presented as a cumulative distribution Assuming now the extreme case where all individuals are identical or where there are no average line touches the x-axis at low, medium or high level of human development. This average-line may be called as the "area of income, education and health components. Any individual within this profile is the average. HDI of this individual is medimensions: income, health and education. If we approximate now the human development of each individual by the national oximate the human development profile we have to be aware that this average Figure 2 - not yet available age, with respect to mean average income allocated independent of age, but if it earns this income, it must be an been attempted yet. ThDisaggregation does not improve the qualities of the HDI directly. The measurement technique is the same. The dissaggregation may be considered as an attempt to approximate the "true" HD profile by calculating several HDIs, for example for geographic regions. Although each new HDI is still an average for the respective region, regional differences of human development are becoming by this process apparent. Further disaggregation of each region into rural and urban areas and the disaggregation of by income may improve this approximation Disaggregated HDI profile is in many examplesimplies graphically the rotation of the "vertical HDI profile" in Figure 2. The profile w rotated HD profile implies inequality of HD among individuals or group of individuals, in this review mainly among regions. Area B1 and B2 in Figure 3 may be considered as the area of inequality of HD, relative to the average. Figure 3 - not yet availableOne may infer easily that the same average value of HD does not necessarily imply the same distribution of HD. Smaller inequality area implies more equal distribution. This is exactly the concern of this study. Closing human development gaps means the improvement of HD by an acceptable or declining area of inequality or the relative decline of area of inequality with respect to the increases in HD, parallel rightward shift Henan Hunan Hubei Inner Mongolia 0.4610.381 Sichuan 0.448 Jiangxi 0.4420.406 0.4250.337 Gansu Guizhou 0.3120.199 0.304 Quinghai 0.0230.029 Source: C. ZHIZHOU (1994) Graph 1: China - not yet availablestudy on China does not supply itself the national (average) HDI. It can be approximated using the disaggregated data and it is 0.527. The sum of, HDI of each administrative unit multiplied by the respective share of population. The HDR 1993 calculates it as 0.566 and puts China within medium development. The difference between the weighted average and national HDI must be partly due to aggregation problem. The overall, national index cannot be built up in a strictly consistent manner from data about the discussion of disparities among subgroups. (approximately) 16%. to be done with care: The regional diFirst, the regional disparities seem to have thin the consciously designed economic plans of the past. Second, the regional imbalances attention should be devoted to gender, rural-urban disparities", probably because these MALAYSIA: ADJUSTED HUMAN DEVELOPMENT INDEXESUnadjusted HDI (1994) Income Distribution-Adjusted HDI Gender Disparity-Adjusted HDI Rural-Urban Disparity-Adjusted HDI Ethnicity-Adjusted HDI -Malays -Chinese -Indians Source: Y.K. LENG, T. AZIZ (1993)The study on Gabon (Obame 1993) calculates minimum index (0.483), one tends to assume t to HD one the most homogeneous societies among all countries, considered in this reviewGABON HDI: 0.519 Urban Rural HDI: 0.538 FemaleHDI: 0.5 HDI by major ethnic groups -Fang -Nzabi-Duma -Shira-Panu J.C. OBAME (1993) number of administrative units (states). A similar analysis can be performed for China. Comparing the HD profile distributions in China was able to transform about 27-30 percent of its population from low level into medium level of HD (Graph 3). years only from 0.096 to 0.086. This is a good example for the firshowever, regional disparities remain, but their relative importance decreases as the Graph 3: China - not yet availableDISAGGREGATED HDI OF NIGERIA 1970 AND 1990Share of PopulationHDI 1990HDI 1970 Rivers Cross Rivers Lagos Gongola Niger Sokota 1990:Area to the right of the average line = B = 0.065Area to the left of the average line = A = 0.181A + B = HDI = 0.2461970: Area to the right of the average line = B = 0.065Area to the left of the average line = A = 0.145A + B = HDI = 0.210 18. Bydgoskie 19. Wroclawskie 20. Piotrkowskie 21. Torunskie 22. Tranobrzeskie 23. Gorzowskie 24. Walbrzyskie 25. Olsztynskie 26. Koszalinskie 0.8050.427 27. Czestochowskie 28. Kieleckie 0.8020.496 29. Krosnienskie 30. Elblaskie 0.7970.461 31. Tarnowskie 32. Kaliskie 33. Slupskie 0.7890.400 34. Skierniewickie 35. Koninskie 0.7720.403 36. Pilskie 0.7700.393 37. Wloclawskie 38. Leszczynskie 39. Sieradzkie 40. Chelmskie 41. Suwalskie 42. Nowosadeckie 43. Bialskopodlaskie 44. Zamojskie 45. Przamyskie 46. Lomzynskie 47. Siedleckie 48. Ciechanowskie 49. Ostroleckie HDI = 0.840, Area to the right of the average line = 0.0228* HDI by national maximum and minimum values.HDI = 0.57574, Area to the right of the average line = 0.054328nts of the index may change only gradually. The short term responsiveness of the index is only due to economic-income changes, that component whose role the concept of HD wanted to limit. All HDR's have presented altered ranks of nations according to their HDI's year by year, however, this was mainly In this respect one may ask a different type of question. Which problem looses most probably its relative importance as a country passes from low to medium development ion problem which dominate all others at low levels of development and it seems to be that disparities due to educatmain cause of disparities at medium level of development. Graph 5: INDIA - not yet availableHDI(1)HDI(2)HDI(3)HDI(4)Share of Pop. Uttar Pradesh 0.3060.1470.503 Madhya Pradesh Rajasthan Orissa Assam Jamu&Kashmir Andhra Pradesh Himachal Pradesh 0.4650.5660.6785.01% West Bengal Karnataka Tamil Nadu 0.4830.5080.6526.78% Haryana Maharasthra Punjap 0.5860.7440.7932.46% 0.6510.7750.7693.53% Source: (1) A.K.S.KUMAR (1990), (2) A.K.S.KUMAR (1991), (3) J.B.G. TILAK (1991), (4) S.P.PAL & D.K.PANT (1994)derived from the first and last columns of Table 6. India is a good example for the discthere are good studies available on India. Another suitable example for low level development is Nigeria, which has been already analyzed. Disaggregated HDI's have first HDR just for Turkey and India (AKDER 1990 and KUMAR 1990). Several Indian academicians haveTable 6 reveals there have been also several attempts to calculate the disaggregated index for India by different methods. The first two by the same author. The first column is more complete. GrTwo features are common almost to all calcul change by different methodsdoes not change very much, except in the third column.