/
How Britain has changed in my lifetime How Britain has changed in my lifetime

How Britain has changed in my lifetime - PowerPoint Presentation

marina-yarberry
marina-yarberry . @marina-yarberry
Follow
348 views
Uploaded On 2018-12-25

How Britain has changed in my lifetime - PPT Presentation

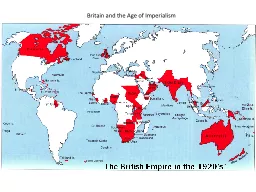
Mohammed Amin MBE FRSA MA FCA AMCT CTAFellow 4 May 2018 Tytherington School Mohammed Amin Mohammed Amin was born in 1950 in Pakistan but has lived in Manchester since 1952 He graduated in mathematics from Cambridge University and before retirement was a tax partner in PricewaterhouseCoo ID: 745877

1950 slide amp empire slide 1950 empire amp amin england 2018 mohammed travel diversity christian world britons 912 1974 075 genome money

Share:

Link:

Embed:

Download Presentation from below link

Download Presentation The PPT/PDF document "How Britain has changed in my lifetime" is the property of its rightful owner. Permission is granted to download and print the materials on this web site for personal, non-commercial use only, and to display it on your personal computer provided you do not modify the materials and that you retain all copyright notices contained in the materials. By downloading content from our website, you accept the terms of this agreement.


Presentation Transcript

Slide1

How Britain has changed in my lifetime

Mohammed Amin MBE FRSA MA FCA AMCT CTA(Fellow)4 May 2018

Tytherington

SchoolSlide2

Mohammed Amin

Mohammed Amin was born in 1950 in Pakistan but has lived in Manchester since 1952.

He graduated in mathematics from Cambridge University and before retirement was a tax partner in PricewaterhouseCoopers.

He believes everyone can help to make the world a better place.

His writings and presentations about a wide range of subjects can be found on his personal website.

www.mohammedamin.com

Slide

2Slide3

Synopsis

Economic changeEducation levels

Technology

Television

TravelEthnic diversityReligious diversity

The UK’s sense of selfQ&A

Slide

3Slide4

Economic change

Slide

4Slide5

UK Real average salary per capita

Slide

5Slide6

My first calculator

1974 Four functions, one memory£40 in 1974 money

Equivalent in 2017 money, RPI adjusted, = £375

2018

Nobody buys calculatorsWebsite article “Richer than Pharaoh?”MA v Rameses II

Slide 6Slide7

Education levels

Slide

7Slide8

Higher education participation

1950 (UK)

3.4%

2015 (England)

49.3%

Slide

8Slide9

Technology

Slide

9Slide10

What I wanted as a teenager

Computer terminal in my bedroomConnected via a cable to a large computer with the world’s information

Availability in 1960’s?

Cost?

What would be the price of my iPhone in 1990?Slide

10Slide11

Biological knowledge

Structure of DNA identified 1953Human Genome Project, 15 years, cost ~ $3bn2017 price ~ $1,000 per human genome

CRISPR-Cas9 ability to edit DNA

Slide

11Slide12

Television

Slide

12Slide13

Explosion of choice

Year

Channels

Viewer control

1950

1

1955

2

1964

3

1975

Video cassette recorders

1982

4

1989

Sky TV launched

2018

1,000+

Digital recorders.

Internet TV.

Catch-up services.

Slide

13Slide14

Travel

Slide

14Slide15

Britons travelling abroad

1950

1 m foreign holidays

2016

70.6 m foreign trips

Slide

15Slide16

Amin family

MA landed in UK 1952First overseas travel 1981Children globetrotters

Slide

16Slide17

Why travel matters

UK is an “insula”Most Briton’s attitudes were insularThe younger generation is different

Slide

17Slide18

Ethnic diversity

Slide

18Slide19

UK demographics

1950 = virtually all white2011 England & Wales census below

Category

Number

%

White

48,209,395

86.0

Mixed race

1,224,400

2.2

Asian

4,213,531

7.5

Afro-Caribbean

1,864,890

3.3

Other

563,696

1.0

56,075,912

100.0

Slide

19Slide20

Religious diversity

Slide

20Slide21

UK religious composition 1950

Hard data difficultOverwhelmingly Christian

Mainly Church of England

Sizeable other Protestant denominations

Roman CatholicsJews the only significant non-Christian minorityOther religions tinySome atheists

Slide 21Slide22

England & Wales 2011 census

Group

Number

%

Christian

33,243,175

59.3

No religion

14,097,229

25.1

Not answered

4,038,032

7.2

Muslim

2,706,066

4.8

Hindu

816,633

1.5

Sikh

423,158

0.8

Jewish

263,346

0.5

Buddhist

247,743

0.4

Other

240,530

0.4

56,075,912

100.0

Slide

22Slide23

The UK’s sense of self

Slide

23Slide24

British Empire 1919-1939

Slide

24Slide25

British Empire statistics

1922 Empire population ~ 458 million = 25% of planet1922 Empire area ~ 33.7 m km2

= ~ 25% of planet

Largest empire in history

Slide 25Slide26

UK 2018

Important countryNuclear weapons state

UNSC Permanent Member

Massive soft power

GDP rank 5 (after USA, China, Japan, Germany) but about to be overtaken by India.Population rank 21World dominated by others to increasing extent

Slide 26Slide27

Compared to 1950, Britons today are…

Far better educated

Know the world far better

Much richer

Much healthierMuch longer livedMore diverselike the rest of the world

Slide 27Slide28

Q & A

Slide 28