PPT-In your journal, create this chart
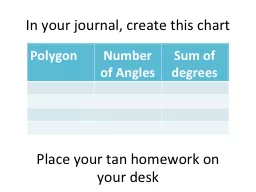
Polygon Number of Angles Sum of degrees Place your tan homework on your desk Expectations Explain how the formula for the sum of angles of a polygon is derived Compute
Download Presentation
"In your journal, create this chart" is the property of its rightful owner. Permission is granted to download and print materials on this website for personal, non-commercial use only, provided you retain all copyright notices. By downloading content from our website, you accept the terms of this agreement. Download
Presentation Transcript
Transcript not available.