PDF-PRICE LIST OF PLOTS
Author : marina-yarberry | Published Date : 2015-09-26
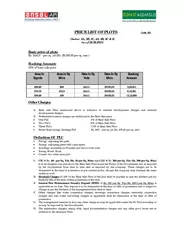
C ode 501 Sector 3A 3B 3C 4A 4B 4C 6 wef 22022013 Basic price of plots Rs 24 411 per sq yd Rs 2919555 per sq mtr Booking Amount 10 of basic sale price Other
Presentation Embed Code
Download Presentation
Download Presentation The PPT/PDF document "PRICE LIST OF PLOTS" is the property of its rightful owner. Permission is granted to download and print the materials on this website for personal, non-commercial use only, and to display it on your personal computer provided you do not modify the materials and that you retain all copyright notices contained in the materials. By downloading content from our website, you accept the terms of this agreement.
PRICE LIST OF PLOTS: Transcript
Download Rules Of Document
"PRICE LIST OF PLOTS"The content belongs to its owner. You may download and print it for personal use, without modification, and keep all copyright notices. By downloading, you agree to these terms.
Related Documents