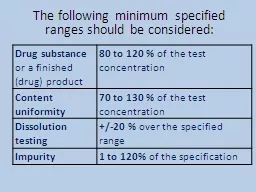
/
The following minimum specified ranges should be considered The following minimum specified ranges should be considered

The following minimum specified ranges should be considered - PowerPoint Presentation

marina-yarberry
marina-yarberry . @marina-yarberry
Follow
415 views
Uploaded On 2016-07-17

The following minimum specified ranges should be considered - PPT Presentation

Drug substance or a finished drug product 80 to 120 of the test concentration Content uniformity 70 to 130 of the test concentration Dissolution testing 20 over the specified range ID: 408364

deviation standard based accuracy standard deviation accuracy based results analyte calibration precision slope curve concentration drug procedure limit minimum

Share:

Link:

Embed:

Download Presentation from below link

Download Presentation The PPT/PDF document "The following minimum specified ranges s..." is the property of its rightful owner. Permission is granted to download and print the materials on this web site for personal, non-commercial use only, and to display it on your personal computer provided you do not modify the materials and that you retain all copyright notices contained in the materials. By downloading content from our website, you accept the terms of this agreement.


Presentation Transcript

Slide1

The following minimum specified ranges should be considered:

Drug substance

or a finished (drug) product

80 to 120 %

of the test concentration

Content uniformity

70 to 130

%

of the test concentration

Dissolution testing

+/-20 %

over the specified range

Impurity

1 to 120%

of the specification Slide2

4. Accuracy and Precision

Accuracy:

The degree to which an experimental result approaches the

true or accepted answerAccuracy – nearness to the truth. Slide3

Ways to Describe Accuracy:

Error

:

The difference between the result obtained by a method and the true or accepted value. Absolute Error d = (X –

µ)

where: X = the experimental result µ = the true resultAll Methods, except counting, contain errors – don’t know “true” value Slide4

Example

Atomic absorption analysis of As

+3

and pb+2 in a sample yield the following resultsAs+3 = 600 µg.ml-1 d = 5 µg. ml-1pb

+2

= 9 µg.ml

-1 d = 0.3 µg.ml-1From absolute error As+3 results is less accurate than pb+2 results but is not true as we see from relative error. E rel As+3 = 5/600 x100 =0.83% E rel pb+2 = 0.3/9 x100 = 3.3 %

As+3 results is more accurate, although it has larger absolute error.Slide5

Several methods of determining accuracy are available:

Drug Substance

(authentic sample)

Application to an analyte of known purity (e.g. reference material);

Comparison with those of a second well-characterized procedure, the accuracy of which is stated and/or defined.

(Reference

methods)Drug Product (formulation)Application to synthetic mixtures of the drug product components to which known quantities of the drug substance to be analyzed have been added; In cases where it is impossible to obtain samples of all drug product components, it may be acceptable either to add known quantities of the analyte to the drug product or to compare the results obtained from a second, well characterized procedure, the accuracy of which is stated and/or defined

Impurities (Quantitation) Accuracy must assessed on samples spiked with known amount of impurities Slide6

Accuracy should be assessed

Using a minimum of

9 determinations

over a minimum of 3 concentration levels covering the specified range (e.g. 3 concentrations /3 replicates each of the total analytical procedure). Accuracy should be reported as percent recoverySlide7

Precision

Precision

:

The degree to which an experimental result varies from one determination to the next. Precision - reproducibilitySlide8
Slide9

Ways to Describe Precision:

Absolute Standard Division

If the results are normally distributed,

68.3 %

of the results can be expected to fall within the range of

± 1

σ

of the mean as a result of random error. Slide10

2. Relative Standard deviation

:

3. Confidence limits

We might use this to estimate the probability that the population mean (µ) lies within a certain region centered atSlide11

Example

A pharmacist determined the % of vitamin C in

Rino

C Tablets, obtaining the following results, = 15.3 σ = 0.1 n= 4Calculate the confidence limit of the mean at probability90% and 99% (t =2.353 at 90 % probability and, 5.841 at probability 99%)Solution

µ = 15.3 ± 2.353 x 0.1/√4 µ = 15.3 ± 0.12

µ = 15.3 ± 5.841 x 0.1/√4 µ = 15.3 ± 0.29Slide12
Slide13

Repeatability should be assessed using

:

A minimum of

9 determinations covering the specified range for the procedure (e.g. 3 concentrations/3 replicates each) or A minimum of 6 determinations at 100% of the test concentration.

Recommended Data: The standard deviation, relative standard deviation (coefficient of variation) and confidence interval should be reported for each type of precision investigated.Slide14

Chromatogram of the same concentration of

Norfloxacin; (a) 5 mg% and the same concentration of

Salicylic acid, (d) 2 mg% id at 274 nm.Slide15

Method Validation- LOD and LOQ

Sensitivity

Limit of detection (LOD) – “the lowest content that canbe measured with reasonable statistical certainty.”إحصائية معقولة من اليقين• Limit of quantitative measurement (LOQ) – “the lowest concentration of an analyte that can be determined with acceptable precision (repeatability) and accuracy under the stated conditions of the test.”

How low can you go?Slide16

Detection Limit

smallest

concentration which can be reported with a specified degree of certainty by a definite, complete analytical procedure.Slide17

Methods of determination

(

depending on whether the procedure is a non-instrumental or instrumental.)

Based on: Visual Evaluation

Signal-to-Noise

T

he Standard Deviation of the Response and the Slope the Standard Deviation of the Blank the Calibration Curve Slide18

Based on Visual Evaluation

I

s determined by the analysis of samples with known concentrations of

analyte and by establishing the minimum level at which the analyte can be reliably detected. Signal-to-NoiseTypically 3 times the signal-to-noise (based on standard deviation of the noise) تداخل موجاتSlide19

The Standard Deviation of the Response and the Slope

The detection limit (DL) may be expressed as:

DL = 3.3 σ/S σ = the standard deviation of the responseS = the slope of the calibration curveThe slope S may be estimated from the calibration curve of the analyte. The estimate of σ may be carried out in a variety of ways, for example:Based on the Standard Deviation of the Blank Based on the Calibration CurveSlide20

Quantitation limit

The

minimum level

at which the analyte can be quantified with acceptable accuracy and precision. Slide21

Based on Signal-to-Noise Approach

Typically

10 times the signal-to-noise (based on standard deviation of the noise) Based on the Standard Deviation of the Response and the Slope The quantization limit (QL) may be expressed as:

QL = 10

σ

/ S Where s= the standard deviation of the response S = the slope of the calibration curve The slope S may be estimated from the calibration curve of the analyte. The slope S may be estimated from the calibration curve of the analyte. The estimate of σ may be carried out in a variety of ways, for example:Based on the Standard Deviation of the Blank Based on the Calibration CurveSlide22

Robustness

Robustness of an analytical procedure is a measure of its

capacity to remain unaffected by small but deliberate variations in method parameters. It should show the reliability during its usage.

Examples of typical variations are:

1. stability of analytical

solutions, 2. extraction time. Examples In the case of liquid chromatography, variations of pH in a mobile phasevariations in mobile phase composition, different columns (different lots and/or suppliers), temperature,

flow rate.In the case of gas-chromatography, examples of typical variations are different columns, temperature, flow rate. Slide23

Ruggedness

Ruggedness of an analytical method is the degree of

reproducibility

of the results obtained by the analysis of the same sample under a variety of normal test conditions. For example different laboratory

,

analysts,

instruments, and reagents. Slide24

System suitability testing

The tests are based on the concept that the

equipment, electronics, analytical operations

and samples to be analyzed constitutes an integral system that can be evaluated as such. ويشكل نظام متكامل يمكن تقييمه على هذا النحو