PPT-Sample: Approximately 4,700 randomly
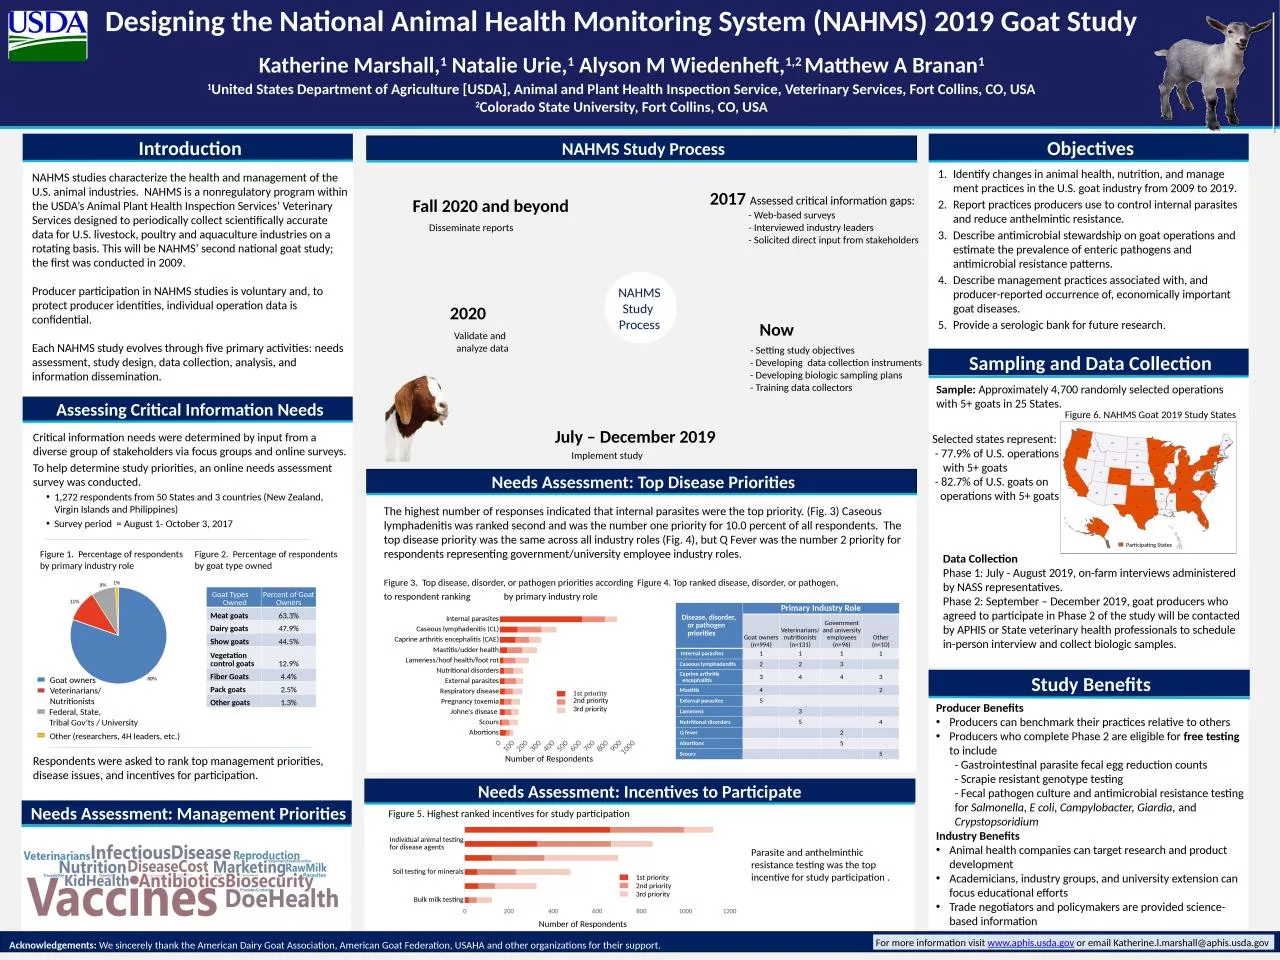
selected operations with 5 goats in 25 States Introduction Identify changes in animal health nutrition and management practices in the US goat industry from 2009
Download Presentation
"Sample: Approximately 4,700 randomly" is the property of its rightful owner. Permission is granted to download and print materials on this website for personal, non-commercial use only, provided you retain all copyright notices. By downloading content from our website, you accept the terms of this agreement.
Presentation Transcript
Transcript not available.