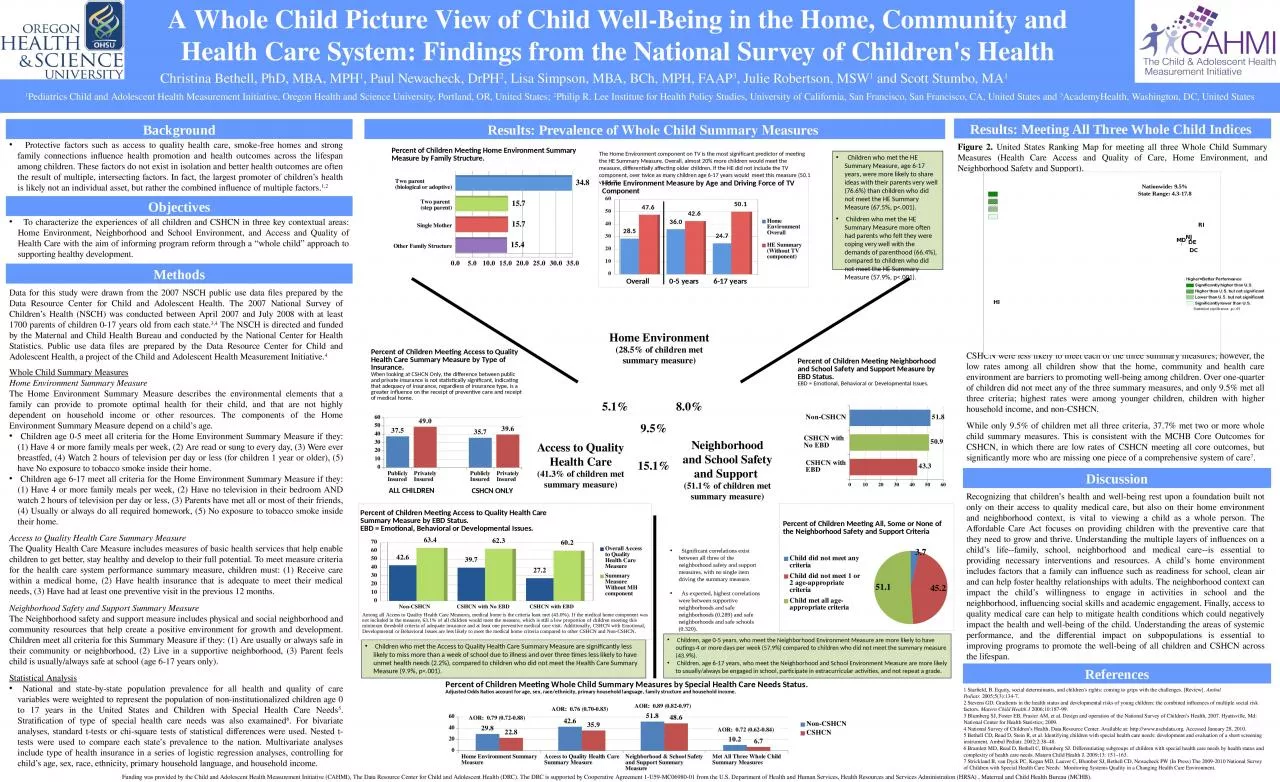
/
A Whole Child Picture View of Child Well-Being in the Home, Community and Health Care A Whole Child Picture View of Child Well-Being in the Home, Community and Health Care

A Whole Child Picture View of Child Well-Being in the Home, Community and Health Care - PowerPoint Presentation

megan
megan . @megan
Follow
65 views
Uploaded On 2024-01-29

A Whole Child Picture View of Child Well-Being in the Home, Community and Health Care - PPT Presentation

Christina Bethell PhD MBA MPH 1 Paul Newacheck DrPH 2 Lisa Simpson MBA BCh MPH FAAP 3 Julie Robertson MSW 1 and Scott Stumbo MA 1 Protective factors such as access to quality health care smokefree homes and strong family connections influence health promotion and h ID: 1042981

children health care summary health children summary care measure child environment neighborhood meet quality age met school access national

Share:

Link:

Embed:

Download Presentation from below link

Download Presentation The PPT/PDF document "A Whole Child Picture View of Child Well..." is the property of its rightful owner. Permission is granted to download and print the materials on this web site for personal, non-commercial use only, and to display it on your personal computer provided you do not modify the materials and that you retain all copyright notices contained in the materials. By downloading content from our website, you accept the terms of this agreement.


Presentation Transcript

1. A Whole Child Picture View of Child Well-Being in the Home, Community and Health Care System: Findings from the National Survey of Children's HealthChristina Bethell, PhD, MBA, MPH1, Paul Newacheck, DrPH2, Lisa Simpson, MBA, BCh, MPH, FAAP3, Julie Robertson, MSW1 and Scott Stumbo, MA1 Protective factors such as access to quality health care, smoke-free homes and strong family connections influence health promotion and health outcomes across the lifespan among children. These factors do not exist in isolation and better health outcomes are often the result of multiple, intersecting factors. In fact, the largest promoter of children’s health is likely not an individual asset, but rather the combined influence of multiple factors.1,2 BackgroundMethodsReferences 1 Starfield, B. Equity, social determinants, and children's rights: coming to grips with the challenges. [Review]. Ambul Pediatr. 2005;5(3):134-7.2 Stevens GD. Gradients in the health status and developmental risks of young children: the combined influences of multiple social risk factors. Matern Child Health J 2006;10:187-99.3 Blumberg SJ, Foster EB, Frasier AM, et al. Design and operation of the National Survey of Children’s Health, 2007. Hyattsville, Md: National Center for Health Statistics; 2009.4 National Survey of Children’s Health. Data Resource Center. Available at: http://www.nschdata.org. Accessed January 28, 2010.5 Bethell CD, Read D, Stein R, et al. Identifying children with special health care needs: development and evaluation of a short screening instrument. Ambul Pediatr. 2002;2:38–48.6 Bramlett MD, Read D, Bethell C, Blumberg SJ. Differentiating subgroups of children with special health care needs by health status and complexity of health care needs. Matern Child Health J. 2009;13: 151–163.7 Strickland B, van Dyck PC, Kogan MD, Lauver C, Blumber SJ, Bethell CD, Newacheck PW (In Press) The 2009-2010 National Survey of Children with Special Health Care Needs: Monitoring Systems Quality in a Changing Health Care Environment.DiscussionData for this study were drawn from the 2007 NSCH public use data files prepared by the Data Resource Center for Child and Adolescent Health. The 2007 National Survey of Children’s Health (NSCH) was conducted between April 2007 and July 2008 with at least 1700 parents of children 0-17 years old from each state.3,4 The NSCH is directed and funded by the Maternal and Child Health Bureau and conducted by the National Center for Health Statistics. Public use data files are prepared by the Data Resource Center for Child and Adolescent Health, a project of the Child and Adolescent Health Measurement Initiative.4 Whole Child Summary MeasuresHome Environment Summary MeasureThe Home Environment Summary Measure describes the environmental elements that a family can provide to promote optimal health for their child, and that are not highly dependent on household income or other resources. The components of the Home Environment Summary Measure depend on a child’s age. Children age 0-5 meet all criteria for the Home Environment Summary Measure if they: (1) Have 4 or more family meals per week, (2) Are read or sung to every day, (3) Were ever breastfed, (4) Watch 2 hours of television per day or less (for children 1 year or older), (5) have No exposure to tobacco smoke inside their home. Children age 6-17 meet all criteria for the Home Environment Summary Measure if they: (1) Have 4 or more family meals per week, (2) Have no television in their bedroom AND watch 2 hours of television per day or less, (3) Parents have met all or most of their friends, (4) Usually or always do all required homework, (5) No exposure to tobacco smoke inside their home.Access to Quality Health Care Summary MeasureThe Quality Health Care Measure includes measures of basic health services that help enable children to get better, stay healthy and develop to their full potential. To meet measure criteria for the health care system performance summary measure, children must: (1) Receive care within a medical home, (2) Have health insurance that is adequate to meet their medical needs, (3) Have had at least one preventive visit in the previous 12 months. Neighborhood Safety and Support Summary MeasureThe Neighborhood safety and support measure includes physical and social neighborhood and community resources that help create a positive environment for growth and development. Children meet all criteria for this Summary Measure if they: (1) Are usually or always safe in their community or neighborhood, (2) Live in a supportive neighborhood, (3) Parent feels child is usually/always safe at school (age 6-17 years only). Statistical Analysis National and state-by-state population prevalence for all health and quality of care variables were weighted to represent the population of non-institutionalized children age 0 to 17 years in the United States and Children with Special Health Care Needs5. Stratification of type of special health care needs was also examained6. For bivariate analyses, standard t-tests or chi-square tests of statistical differences were used. Nested t-tests were used to compare each state’s prevalence to the nation. Multivariate analyses include type of health insurance in a series of logistic regression analyses, controlling for child’s age, sex, race, ethnicity, primary household language, and household income. Recognizing that children’s health and well-being rest upon a foundation built not only on their access to quality medical care, but also on their home environment and neighborhood context, is vital to viewing a child as a whole person. The Affordable Care Act focuses on providing children with the preventive care that they need to grow and thrive. Understanding the multiple layers of influences on a child’s life--family, school, neighborhood and medical care--is essential to providing necessary interventions and resources. A child’s home environment includes factors that a family can influence such as readiness for school, clean air and can help foster healthy relationships with adults. The neighborhood context can impact the child’s willingness to engage in activities in school and the neighborhood, influencing social skills and academic engagement. Finally, access to quality medical care can help to mitigate health conditions which could negatively impact the health and well-being of the child. Understanding the areas of systemic performance, and the differential impact on subpopulations is essential to improving programs to promote the well-being of all children and CSHCN across the lifespan. Objectives To characterize the experiences of all children and CSHCN in three key contextual areas: Home Environment, Neighborhood and School Environment, and Access and Quality of Health Care with the aim of informing program reform through a “whole child” approach to supporting healthy development.Results: Prevalence of Whole Child Summary Measures Figure 2. United States Ranking Map for meeting all three Whole Child Summary Measures (Health Care Access and Quality of Care, Home Environment, and Neighborhood Safety and Support).Funding was provided by the Child and Adolescent Health Measurement Initiative (CAHMI), The Data Resource Center for Child and Adolescent Health (DRC). The DRC is supported by Cooperative Agreement 1-U59-MC06980-01 from the U.S. Department of Health and Human Services, Health Resources and Services Administration (HRSA) , Maternal and Child Health Bureau (MCHB).1Pediatrics Child and Adolescent Health Measurement Initiative, Oregon Health and Science University, Portland, OR, United States; 2Philip R. Lee Institute for Health Policy Studies, University of California, San Francisco, San Francisco, CA, United States and 3AcademyHealth, Washington, DC, United StatesResults: Meeting All Three Whole Child Indices CSHCN were less likely to meet each of the three summary measures; however, the low rates among all children show that the home, community and health care environment are barriers to promoting well-being among children. Over one-quarter of children did not meet any of the three summary measures, and only 9.5% met all three criteria; highest rates were among younger children, children with higher household income, and non-CSHCN.While only 9.5% of children met all three criteria, 37.7% met two or more whole child summary measures. This is consistent with the MCHB Core Outcomes for CSHCN, in which there are low rates of CSHCN meeting all core outcomes, but significantly more who are missing one piece of a comprehensive system of care7.Nationwide: 9.5%State Range: 4.3-17.8Home Environment (28.5% of children met summary measure)Neighborhood and School Safety and Support (51.1% of children met summary measure)Access to Quality Health Care(41.3% of children met summary measure)9.5% Children who met the HE Summary Measure, age 6-17 years, were more likely to share ideas with their parents very well (76.6%) than children who did not meet the HE Summary Measure (67.5%, p<.001). Children who met the HE Summary Measure more often had parents who felt they were coping very well with the demands of parenthood (66.4%), compared to children who did not meet the HE Summary Measure (57.9%, p<.001). Children who met the Access to Quality Health Care Summary Measure are significantly less likely to miss more than a week of school due to illness and over three times less likely to have unmet health needs (2.2%), compared to children who did not meet the Health Care Summary Measure (9.9%, p<.001). Children, age 0-5 years, who meet the Neighborhood Environment Measure are more likely to have outings 4 or more days per week (57.9%) compared to children who did not meet the summary measure (43.9%). Children, age 6-17 years, who meet the Neighborhood and School Environment Measure are more likely to usually/always be engaged in school, participate in extracurricular activities, and not repeat a grade.8.0%5.1%15.1%The Home Environment component on TV is the most significant predictor of meeting the HE Summary Measure. Overall, almost 20% more children would meet the measure, differentially affecting older children. If the HE did not include the TV component, over twice as many children age 6-17 years would meet this measure (50.1 vs 24.7). Significant correlations exist between all three of the neighborhood safety and support measures, with no single item driving the summary measure. As expected, highest correlations were between supportive neighborhoods and safe neighborhoods (0.289) and safe neighborhoods and safe schools (0.320).