/
Combination of event-related potentials and cerebrospinal fluid biomarkers in early diagnosis Combination of event-related potentials and cerebrospinal fluid biomarkers in early diagnosis

Combination of event-related potentials and cerebrospinal fluid biomarkers in early diagnosis - PowerPoint Presentation

megan
megan . @megan
Follow
0 views
Uploaded On 2024-03-15

Combination of event-related potentials and cerebrospinal fluid biomarkers in early diagnosis - PPT Presentation

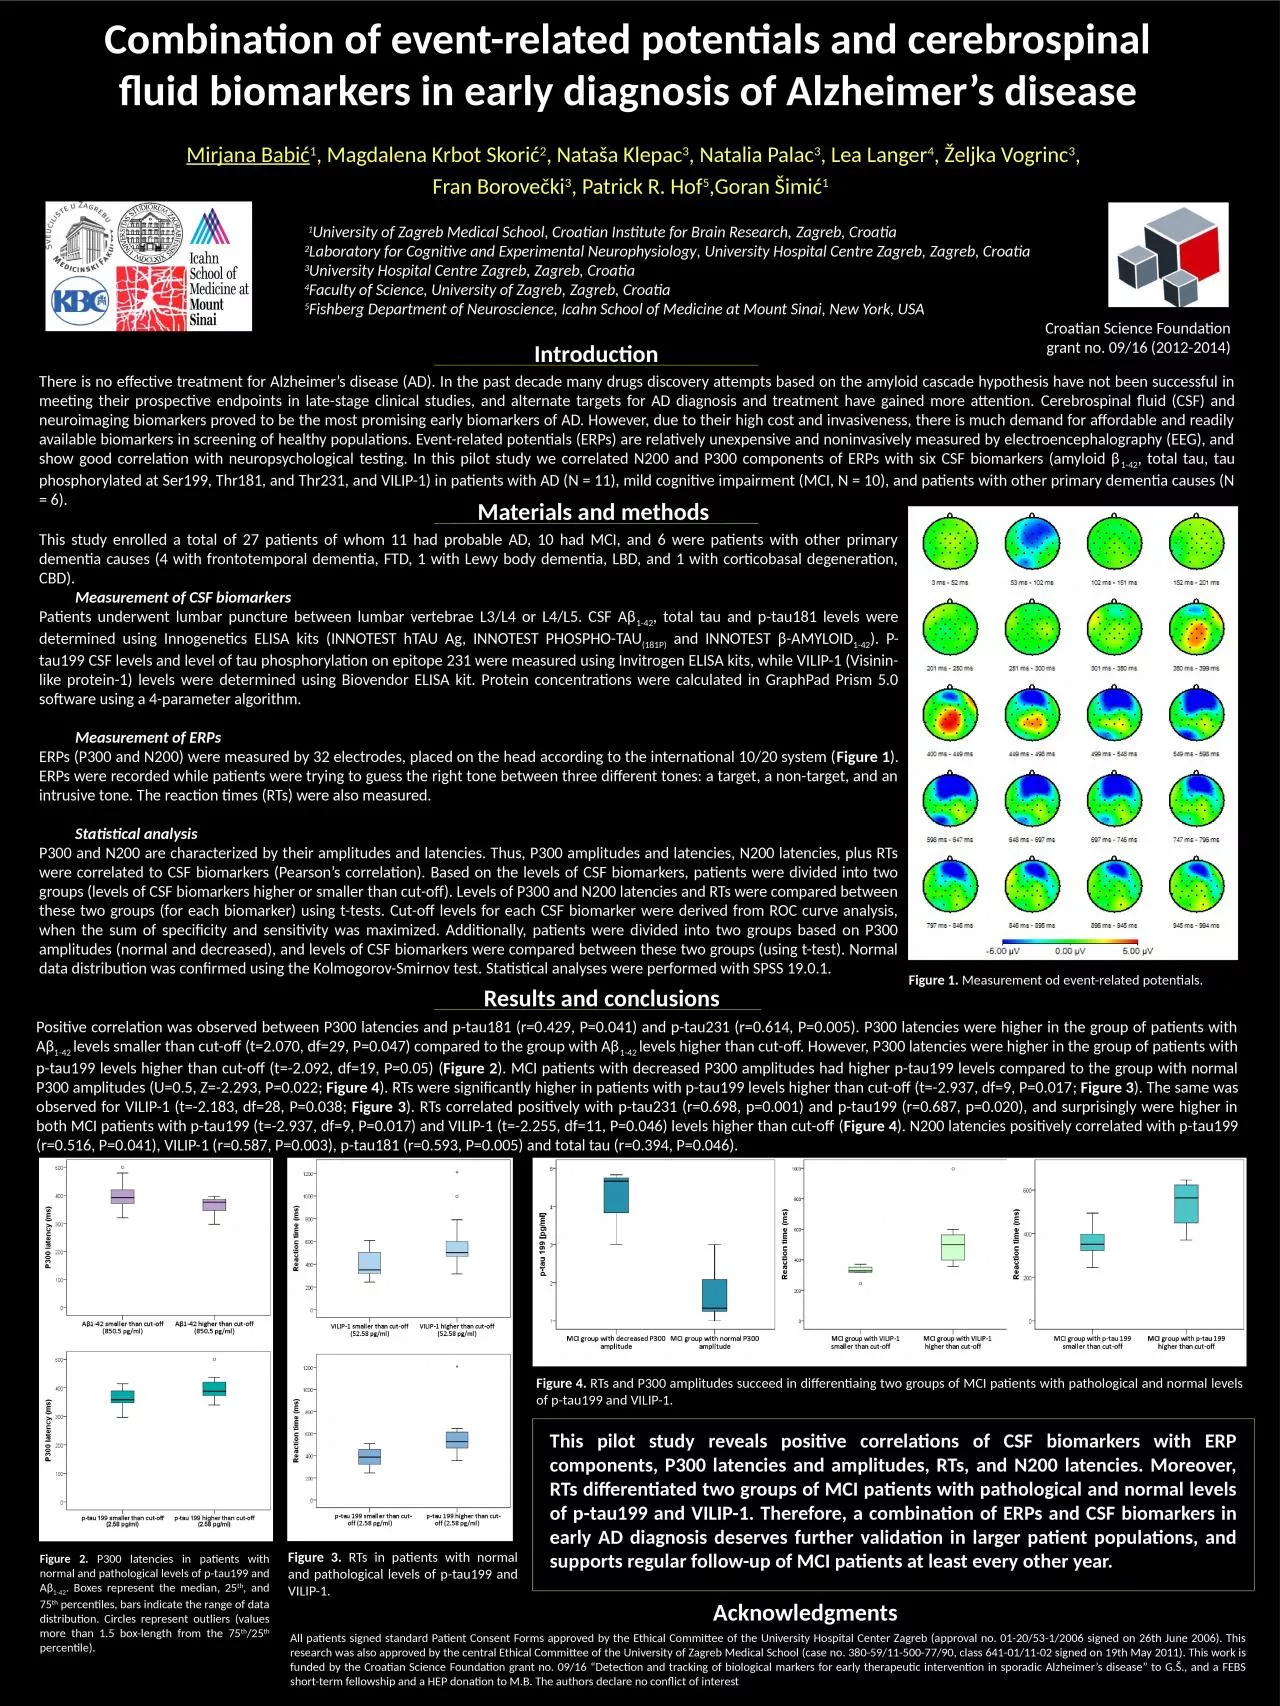
s disease Mirjana Babić 1 Magdalena Krbot Skorić 2 Nataša Klepac 3 Natalia Palac 3 Lea Langer 4 Željka Vogrinc 3 Fran Borovečki 3 Patrick R Hof ID: 1048672

levels patients csf p300 patients levels p300 csf tau199 biomarkers latencies higher zagreb rts figure vilip mci normal n200

Share:

Link:

Embed:

Download Presentation from below link

Download Presentation The PPT/PDF document "Combination of event-related potentials ..." is the property of its rightful owner. Permission is granted to download and print the materials on this web site for personal, non-commercial use only, and to display it on your personal computer provided you do not modify the materials and that you retain all copyright notices contained in the materials. By downloading content from our website, you accept the terms of this agreement.


Presentation Transcript

1. Combination of event-related potentials and cerebrospinal fluid biomarkers in early diagnosis of Alzheimer’s disease Mirjana Babić1, Magdalena Krbot Skorić2, Nataša Klepac3, Natalia Palac3, Lea Langer4, Željka Vogrinc3, Fran Borovečki3, Patrick R. Hof5,Goran Šimić1 1University of Zagreb Medical School, Croatian Institute for Brain Research, Zagreb, Croatia2Laboratory for Cognitive and Experimental Neurophysiology, University Hospital Centre Zagreb, Zagreb, Croatia3University Hospital Centre Zagreb, Zagreb, Croatia4Faculty of Science, University of Zagreb, Zagreb, Croatia5Fishberg Department of Neuroscience, Icahn School of Medicine at Mount Sinai, New York, USAIntroductionMaterials and methodsThere is no effective treatment for Alzheimer’s disease (AD). In the past decade many drugs discovery attempts based on the amyloid cascade hypothesis have not been successful in meeting their prospective endpoints in late-stage clinical studies, and alternate targets for AD diagnosis and treatment have gained more attention. Cerebrospinal fluid (CSF) and neuroimaging biomarkers proved to be the most promising early biomarkers of AD. However, due to their high cost and invasiveness, there is much demand for affordable and readily available biomarkers in screening of healthy populations. Event-related potentials (ERPs) are relatively unexpensive and noninvasively measured by electroencephalography (EEG), and show good correlation with neuropsychological testing. In this pilot study we correlated N200 and P300 components of ERPs with six CSF biomarkers (amyloid β1-42, total tau, tau phosphorylated at Ser199, Thr181, and Thr231, and VILIP-1) in patients with AD (N = 11), mild cognitive impairment (MCI, N = 10), and patients with other primary dementia causes (N = 6).This study enrolled a total of 27 patients of whom 11 had probable AD, 10 had MCI, and 6 were patients with other primary dementia causes (4 with frontotemporal dementia, FTD, 1 with Lewy body dementia, LBD, and 1 with corticobasal degeneration, CBD). Measurement of CSF biomarkersPatients underwent lumbar puncture between lumbar vertebrae L3/L4 or L4/L5. CSF Aβ1-42, total tau and p-tau181 levels were determined using Innogenetics ELISA kits (INNOTEST hTAU Ag, INNOTEST PHOSPHO-TAU(181P) and INNOTEST β-AMYLOID1-42). P-tau199 CSF levels and level of tau phosphorylation on epitope 231 were measured using Invitrogen ELISA kits, while VILIP-1 (Visinin-like protein-1) levels were determined using Biovendor ELISA kit. Protein concentrations were calculated in GraphPad Prism 5.0 software using a 4-parameter algorithm. Measurement of ERPsERPs (P300 and N200) were measured by 32 electrodes, placed on the head according to the international 10/20 system (Figure 1). ERPs were recorded while patients were trying to guess the right tone between three different tones: a target, a non-target, and an intrusive tone. The reaction times (RTs) were also measured. Statistical analysisP300 and N200 are characterized by their amplitudes and latencies. Thus, P300 amplitudes and latencies, N200 latencies, plus RTs were correlated to CSF biomarkers (Pearson’s correlation). Based on the levels of CSF biomarkers, patients were divided into two groups (levels of CSF biomarkers higher or smaller than cut-off). Levels of P300 and N200 latencies and RTs were compared between these two groups (for each biomarker) using t-tests. Cut-off levels for each CSF biomarker were derived from ROC curve analysis, when the sum of specificity and sensitivity was maximized. Additionally, patients were divided into two groups based on P300 amplitudes (normal and decreased), and levels of CSF biomarkers were compared between these two groups (using t-test). Normal data distribution was confirmed using the Kolmogorov-Smirnov test. Statistical analyses were performed with SPSS 19.0.1.Results and conclusionsThis pilot study reveals positive correlations of CSF biomarkers with ERP components, P300 latencies and amplitudes, RTs, and N200 latencies. Moreover, RTs differentiated two groups of MCI patients with pathological and normal levels of p-tau199 and VILIP-1. Therefore, a combination of ERPs and CSF biomarkers in early AD diagnosis deserves further validation in larger patient populations, and supports regular follow-up of MCI patients at least every other year. Positive correlation was observed between P300 latencies and p-tau181 (r=0.429, P=0.041) and p-tau231 (r=0.614, P=0.005). P300 latencies were higher in the group of patients with Aβ1-42 levels smaller than cut-off (t=2.070, df=29, P=0.047) compared to the group with Aβ1-42 levels higher than cut-off. However, P300 latencies were higher in the group of patients with p-tau199 levels higher than cut-off (t=-2.092, df=19, P=0.05) (Figure 2). MCI patients with decreased P300 amplitudes had higher p-tau199 levels compared to the group with normal P300 amplitudes (U=0.5, Z=-2.293, P=0.022; Figure 4). RTs were significantly higher in patients with p-tau199 levels higher than cut-off (t=-2.937, df=9, P=0.017; Figure 3). The same was observed for VILIP-1 (t=-2.183, df=28, P=0.038; Figure 3). RTs correlated positively with p-tau231 (r=0.698, p=0.001) and p-tau199 (r=0.687, p=0.020), and surprisingly were higher in both MCI patients with p-tau199 (t=-2.937, df=9, P=0.017) and VILIP-1 (t=-2.255, df=11, P=0.046) levels higher than cut-off (Figure 4). N200 latencies positively correlated with p-tau199 (r=0.516, P=0.041), VILIP-1 (r=0.587, P=0.003), p-tau181 (r=0.593, P=0.005) and total tau (r=0.394, P=0.046).Acknowledgments All patients signed standard Patient Consent Forms approved by the Ethical Committee of the University Hospital Center Zagreb (approval no. 01-20/53-1/2006 signed on 26th June 2006). This research was also approved by the central Ethical Committee of the University of Zagreb Medical School (case no. 380-59/11-500-77/90, class 641-01/11-02 signed on 19th May 2011). This work is funded by the Croatian Science Foundation grant no. 09/16 “Detection and tracking of biological markers for early therapeutic intervention in sporadic Alzheimer’s disease” to G.Š., and a FEBS short-term fellowship and a HEP donation to M.B. The authors declare no conflict of interestFigure 1. Measurement od event-related potentials. Figure 2. P300 latencies in patients with normal and pathological levels of p-tau199 and Aβ1-42. Boxes represent the median, 25th, and 75th percentiles, bars indicate the range of data distribution. Circles represent outliers (values more than 1.5 box-length from the 75th/25th percentile).Figure 3. RTs in patients with normal and pathological levels of p-tau199 and VILIP-1. Figure 4. RTs and P300 amplitudes succeed in differentiaing two groups of MCI patients with pathological and normal levels of p-tau199 and VILIP-1.Croatian Science Foundation grant no. 09/16 (2012-2014)