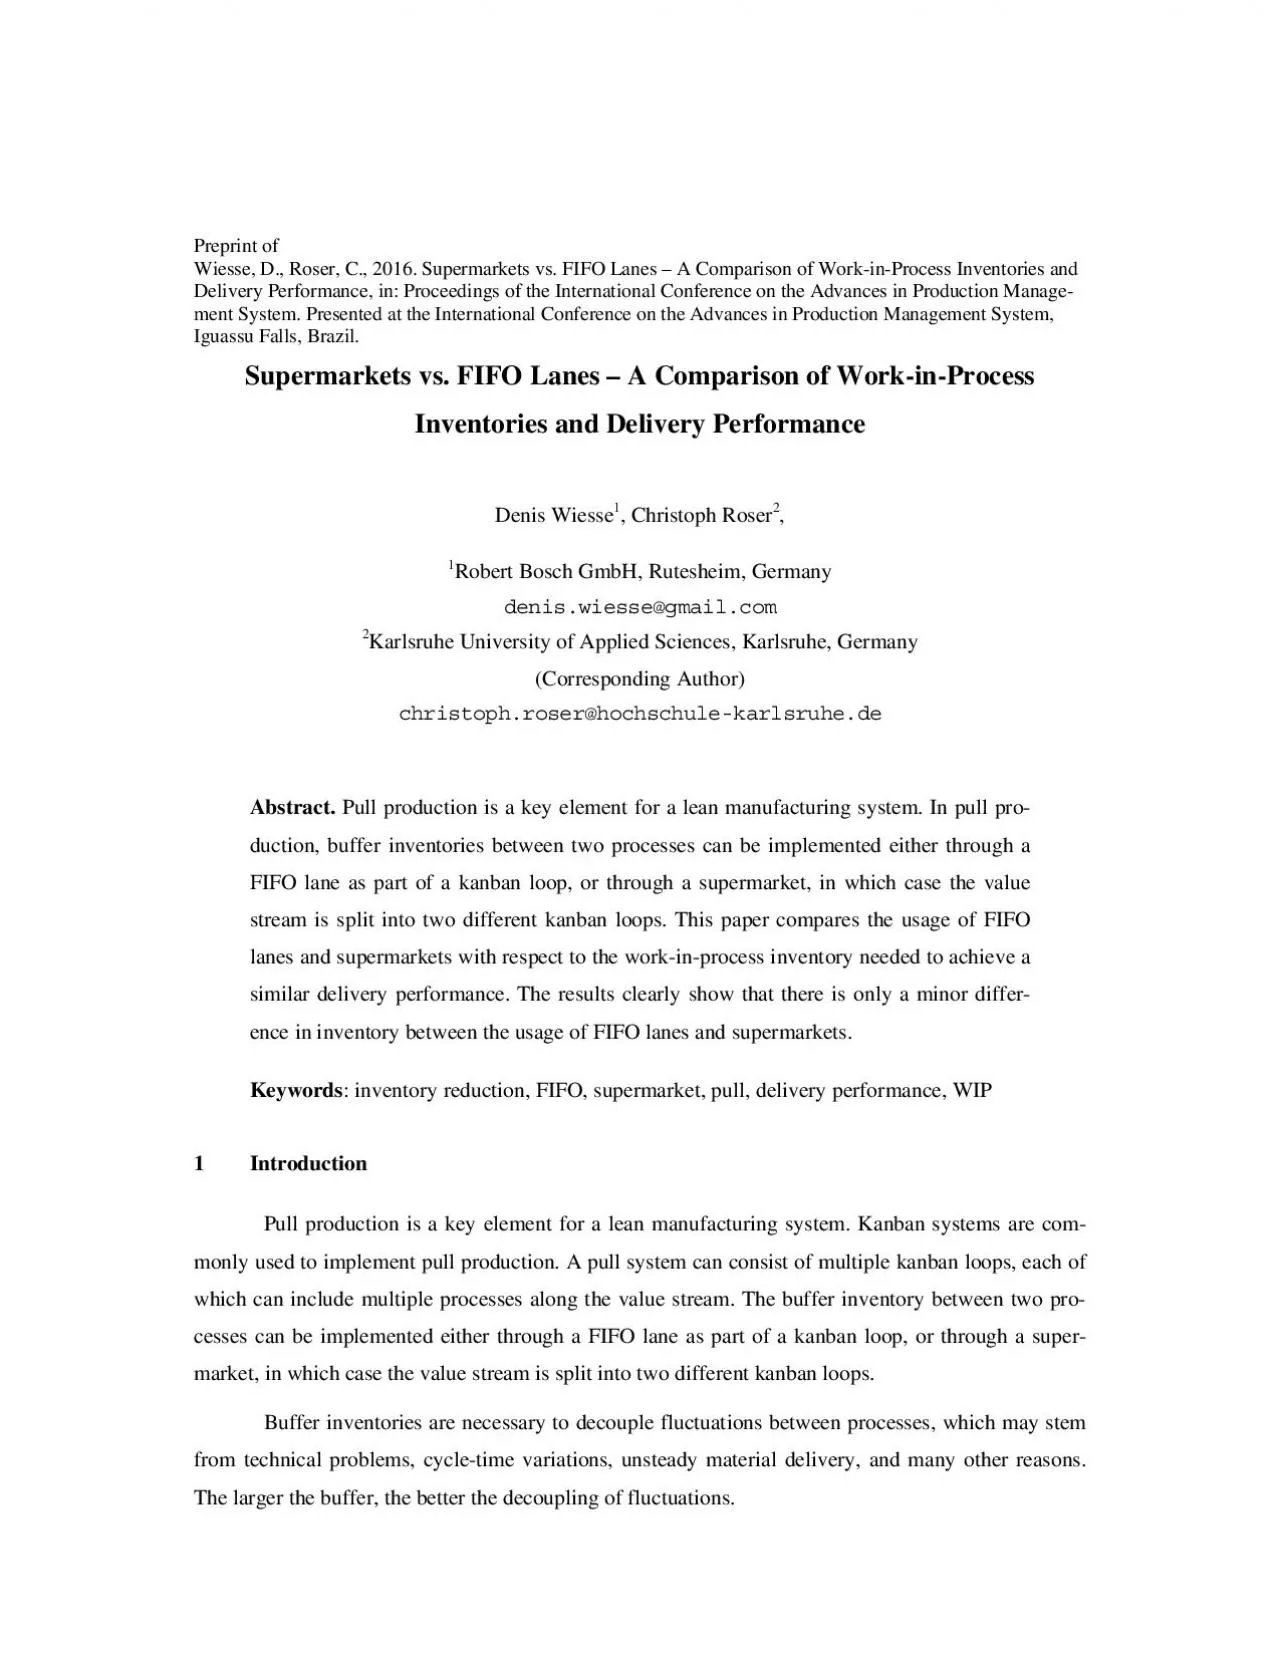
/
Preprint of Wiesse D Roser C 2016 Supermarkets vs FIFO Lanes Preprint of Wiesse D Roser C 2016 Supermarkets vs FIFO Lanes

Preprint of Wiesse D Roser C 2016 Supermarkets vs FIFO Lanes - PDF document

melody
melody . @melody
Follow
344 views
Uploaded On 2021-07-04

Preprint of Wiesse D Roser C 2016 Supermarkets vs FIFO Lanes - PPT Presentation

Yet buffer inventories also cause significant costs Industry usually calculates the cost due to the bound capital sometimes also including storage and handling cost What is usually not included is ID: 853366

loop system fifo delivery system loop delivery fifo wip performance kanban single supermarket systems time material double pull inventory

Share:

Link:

Embed:

Download Presentation from below link

Download Pdf The PPT/PDF document "Preprint of Wiesse D Roser C 2016 Superm..." is the property of its rightful owner. Permission is granted to download and print the materials on this web site for personal, non-commercial use only, and to display it on your personal computer provided you do not modify the materials and that you retain all copyright notices contained in the materials. By downloading content from our website, you accept the terms of this agreement.


Presentation Transcript

1 Preprint of Wiesse, D., Roser, C., 2016.
Preprint of Wiesse, D., Roser, C., 2016. Supermarkets vs. FIFO Lanes – A Comparison of Work-in-Process Inventories and Delivery Performance, in: Proceedings of the International Conference on the Advances in Production Manage- Yet, buffer inventories also cause significant costs. Industry usually calculates the cost due to the bound capital, sometimes also including storage and handling cost. What is usually not included is the delay of information through the material flow (e.g., detecting flawed parts too late), obsolescence cost, deterioration over time, etc. [1]. One of the key insights in lean manufacturing is to realize the significance of these inventory-related costs and to pursue inventory reduction as part of the continu-ous improvement process. When establishing a pull production, between each pair of sequential processes the designers have the option to add a FIFO lane as part of a bigger kanban loop, or to add a supermarket and split the flow into two kanban loops (see Fig. 1 below for the example used within this analysis). There are no fixed rules on when to use a FIFO and when to use a supermarket, although there are recommended guidelines [2]. In general, it is recommended to use a FIFO lane, which is much easier to manage, un-less there are compelling reasons to go for a supermarket. This paper compares the usage of FIFO and supermarket with respect to both work-in-process and delivery performance. The goal is to determine if a supermarket or a FIFO requires less work-in-process inventory for the same delivery performance. Is it better for inventory to have a supermar-ket or a FIFO between processes? This paper is based on a master thesis by one of the authors, su-pervised by the other author [3]. To the

2 best of our knowledge such a comparison
best of our knowledge such a comparison has not yet been undertaken before. However, before we go into the details of the analysis, we first need to define the terms as used within this paper. Definition of Push and Pull While the term pull is used almost everywhere in lean manufacturing, the definition of pull is often quite different. It is only agreed that is the opposite of . Powell and Arica recently sur-veyed the literature and found around 30 definitions in production management, supply chain man-agement, and project management [4]. Within this paper we follow the, in our view, most compelling definition by Hopp and Spearman: A pull production system is one that explicitly limits the amount of work in process that can be in the system. By default, this implies that a push pro-duction system is one that has no explicit limit on the amount of work in pro-cess that can be in the system . 1.2 Definition of FIFO Lanes A FIFO lane stands for First-In, First-Out. This automatically gives the first part of a defini-tion, which requires that the parts leave in the same sequence as they arrive [6]. However, since the FIFO lane is part of a pull system, it needs to incorporate the definition of pull from above and needs to have an upper limit on inventory. This brings us to our own definition of a FIFO lane: A FIFO lane is an inventory where the parts leave in the same sequence as they arrive. There is a limit to the maximum inventory. If the FIFO lane is full, the receding process stops. Definition of Supermarkets A supermarket differs from a FIFO lane in that the material flow and the information flow splits. In a FIFO lane, the material automatically includes the information on what the material is. If material is remo

3 ved from a supermarket, the information
ved from a supermarket, the information on the part goes back to the beginning of the kanban loop to replenish the part. This information is the kanban. A supermarket consists of multiple parallel FIFO lanes, one for each material type that is handled by the supermarket. As with the FIFO lane, the supermarket has an upper limit on the number of parts, although this is usually maintained through the number of kanban in circulation and not implemented separately. This leads us to our def-inition of supermarket: A supermarket is an inventory where the parts are stored separately by type. The parts by type leave in the same sequence as they arrive. When a part leaves, information is sent back along the value stream to replenish the part. Definition of Work-in-Process Inventory The definition of work in process is rather straightforward. Work in process (WIP) is the amount of material – measured in pieces, or by weight, volume, or value – for one part type or for multiple part types com-bined for a certain section of the value stream. Depending on the situation, this may or may not include the supermarket inventory. For our purposes, we do include the supermarket inventory to get a reasonable comparison between a system with a FIFO and a system with a supermarket. For pull systems, this quantity has to be limited. In kan-ban systems, it is limited through the number of kanban [7]. Definition of Delivery Performance Delivery performance aims to measure the reliability of satisfying customer orders, both quan-tity-wise and timewise (i.e., in full on time[8]. Disagreement exists in industry if a too-early delivery is counted as good or not, which tolerances are allowed around the scheduled delivery date, and if the scheduled d

4 elivery date is the first date requested
elivery date is the first date requested by the customer or the date agreed on between cus-tomer and supplier. For our purposes, we define delivery performance as follows: Percentage of the customer orders that can be fulfilled on time and in full. Analysis For the analysis, a simulation environment was used. This allows for an easy gathering of data and comparison of different systems. Analyzed System For a stringent comparison, we analyzed a simple system consisting only of two processes, P1 and P2, and a single product variant. Two different systems were compared, where either a single kan-ban loop includes both processes with a FIFO in between, or the system is split into two different kan-ban loops. This is shown in Fig. 1 below as a) and b) respectively. For the diagrams, we used standard value stream mapping notation as introduced by Rother and Shook [9]. P1 Two processes connected through FIFO within one kanban loop (a) or split into two different kanban loops using a supermarket (b) Intuitively, a supermarket has more inventory than a FIFO lane. However, having a longer re-plenishment time in a) requires one large supermarket at the end, whereas the two separate loops in b) each have a shorter replenishment time and hence both supermarkets require less material for a similar delivery performance. In the following, we will call a) a single-loop system, and b) a double-loop systemSystem Settings The systems in Fig. 1 have been compared using different settings of cycle times and customer demand to represent a variety of different situations that may be expected in industry. Since the dura-tions are all relative to each other, no time units are required, although for simulation purposes, minutes were used. Table

5 1 gives an overview of the tested system
1 gives an overview of the tested systems. We examined systems that had both equal cycle times and unequal cycle times. Additional systems were tested in the original master thesis with similar results [3]. The systems have been simulated using the commercial Simul8 software package. System Cycle Time P1 Cycle Time P2 Customer Takt 1 10 10 12 2 10 9 12 Overview of the mean time between parts of the simulated systems. All times were exponen-tially distributed. All times were exponentially distributed. The duration of each simulation exceeded 8,000 parts, excluding a warm-up period of 300 parts. Each simulation was repeated at least 51 times to veri-fy the accuracy of the results using confidence intervals. All systems have been simulated using a wide range for the number of kanban both for a sin-gle-loop and a double-loop system to determine the relation between the WIP and the delivery perfor-mance. For example, the single-loop system 1 has been simulated with any number of kanban cards between 1 and 40 in combination with any number of FIFO capacity between 1 and 40. In total, 1,600 simulations have been repeated 51 times, each merely for the single-loop system with equal cycle times and a slow customer takt. The double-loop system 1 has been simulated with any number of kanban cards between 1 and 30 for each loop (i.e., a total of 900 simulations, all of them repeated 51 times for accuracy). Similar simulations were performed for system 2 both for the single-loop and double-loop sys-tem. Simulations of additional systems can be found in [3]. In all cases, the best combination of WIP and delivery performance were determined, as well as the expected results, using a standard kanban formula. Overall, in excess of 30

6 0,000 simulations using weeks of computa
0,000 simulations using weeks of computation time were used to de-rive the data below. Analysis Results System 1 – Equal Cycle Time All combinations of kanban cards between 1 and 40, and FIFO capacity between 1 and 40, for the single loop as well as all combinations of number of kanban cards for both loops between 1 and 30 have been simulated. Both the delivery performance and the WIP have been measured for each simu-lation. Fig. 2 shows the best combination with minimal WIP for any delivery performance between 0 and 100% for both the single-loop and the double-loop system. 0% 10% 20% 40% 50% 60% 70% 80% 90% 100% System 1 –Equal Cycle TimeDelivery performance (%)WIP (Pieces)Single loop system Double loop system Delivery performance vs. WIP for system 1 with equal cycle times As expected, a higher WIP through a higher number of kanban and FIFO capacity improves the delivery performance. The relation is not linear, and a disproportionally larger inventory is needed to achieve a near-perfect delivery performance. The optimal combination of WIP and delivery perfor-mance for both the single-loop and the double-loop system looks very similar. Additional statistical analysis, however, confirms that the two curves are indeed statistically significant different for deliv-ery performances in excess of 30% [3]. This analysis shows that the single-loop system a) in Fig. 1 requires less WIP to achieve the same delivery performance as the alternative double-loop system b). System 2 – Unequal Cycle Time The second system is similar to system 1, except that the second process P2 now has a faster mean cycle time of nine time units instead of ten time units. Fig. 3 shows again the best combination of WIP and delivery performance for th

7 e single-loop and double-loop system. Ag
e single-loop and double-loop system. Again, the single-loop system requires statistically significant less WIP for the same delivery performance compared to the double-loop system. 0% 10% 20% 30% 50% 60% 70% 80% 90% 100% 15 20 25 System 2 –Unequal Cycle Time, P2 fasterDelivery performance (%)WIP (Pieces)Single loop system Double loop system Fig. 3. Delivery performance vs. WIP for system 2 with unequal cycle time, P2 faster Interpretation of Results In all simulated systems (and additional systems found in [3]), the single-loop system requires less WIP for the same delivery performance. These results are statistically significant for delivery per-formances above 50%. This means that since most companies have a delivery performance above 40%, these results are statistically significant. The single-loop system is able to “work ahead” more during times of low demand. Fig. 4 shows the material distribution for times with low or no demand. In the single-loop systems, all kan-ban would eventually end up with material in the supermarket, and all WIP would be concentrated in the supermarket. If demand would pick up again, the single-loop system would be theoretically able to deliver products equivalent to all kanban cards immediately. P1 P2 FIFO P2 WIP locations during low demand A double-loop system, however, would have only part of the material in the final supermarket, and part of the material in the intermediate supermarket. The exact allocation of the WIP depends on the number of kanban cards in each loop. Hence, the double-loop system would theoretically be able to deliver only the material equivalent to the last kanban loop. If the demand would be higher, material from the intermediate supermarket would first have to

8 pass through process P2. Conclusion an
pass through process P2. Conclusion and Summary Since delivery performance is a benefit but WIP is a cost, a system that has better delivery per-formance for the same WIP (or the same delivery performance for less WIP) performs better. In all tested systems, the single-loop system was statistically significant better than a double-loop system. However, statistically significant does not necessarily mean practically significant! The single-loop system would come at a cost of potentially quite uneven material distribution as shown in Fig. 4 part a) above. Besides reduction in WIP, however, lean manufacturing also emphasizes a level produc-tion. The idea of having a pile of material at one point but none at the other goes against lean thinking. It is difficult to quantify, but it is definitely one reason against using a single-loop system despite low-er WIP. For a delivery performance of around 95%, the single-loop system required about 20% less WIP in both cases. Hence, there would be a small benefit in WIP. Yet, these results were achieved only after exhaustive testing of all possible combinations of number of kanban and FIFO capacities. In reality, such an exhaustive test is usually not possible. Instead, the number of kanban cards are esti-mated using either gut feeling or a kanban formula – which by itself is also nothing but a rough esti-mation with a significant margin of error. For the FIFO capacity, an expert estimate is the most com-mon way in industry, which is also quite uncertain. Overall, it is unlikely that a real line will get the “just right” number of kanban cards and FIFO capacity to benefit from these optimal conditions. As a conclusion, using a single-loop has a small advantage in respect to WIP and d

9 elivery per-formance. However, in practi
elivery per-formance. However, in practice there are many other considerations that can easily overrule the small WIP benefit of a single-loop system. References [1] H. Richardson, “Control your costs–then cut them,” Transp. Distrib., vol. 36, no. 12, p. 94, Dec. 1995. [2] C. Roser and M. Nakano, “Guidelines for the Selection of FIFO Lanes and Supermarkets for Kanban-Based Pull Systems – When to Use a FIFO and When to Use a Supermarket,” in ceedings of the International Conference on the Advances in Production Management SystemTokyo, Japan, 2015. [3] D. Wiesse, “Analyse des Umlaufbestandes von Verbrauchssteuerungen in Abhängigkeit von der Nutzung von Supermärkten und FiFo-Strecken,” Karlsruhe University of Applied Sciences, Karlsruhe, Germany, 2015. [4] D. Powell and E. Arica, “To Pull or Not to Pull: A Concept Lost in Translation?,” Am. J. Manag., vol. 15, no. 2, pp. 64–73. [5] W. J. Hopp and M. L. Spearman, “To Pull or Not to Pull: What Is the Question?,” Manuf. Serv. Oper. Manag., vol. 6, no. 2, pp. 133–148, Apr. 2004. [6] C. Marchwinski and J. Shook, Lean Lexicon: A Graphical Glossary for Lean Thinkers. Lean Enterprise Institute, 2003. [7] U. S. Karmarkar, “Kanban Systems,” Center for Manufacturing and Operations Management, Graduate School of Management, University of Rochester, Rochester, NY, USA, QM8612, Jun. 1986. [8] C. M. Rao, K. P. Rao, and V. V. Muniswamy, “Delivery Performance Measurement in an Inte-grated Supply Chain Management: Case Study in Batteries Manufacturing Firm,” Serbian J. Manag., vol. 6, no. 2, pp. 205–220, 2011. [9] M. Rother and J. Shook, Learning to See: Value-Stream Mapping to Create Value and Eliminate Muda: Value Stream Mapping to Add Value and Eliminate Muda. Lean Enterprise Institute, 1