/
1 Introduction: Traumatic Brain Injury 1 Introduction: Traumatic Brain Injury

1 Introduction: Traumatic Brain Injury - PowerPoint Presentation

min-jolicoeur
min-jolicoeur . @min-jolicoeur
Follow
377 views
Uploaded On 2018-11-06

1 Introduction: Traumatic Brain Injury - PPT Presentation

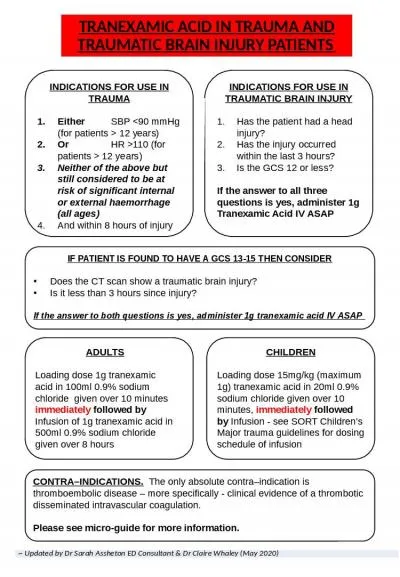
Chris Rorden Deficits associated with focal injury Typical scanning modalities 2 Describing cortex location Brodmann Areas BAs 1909 Appearance of cortex under microscope Not necessarily function ID: 717334

contrast injury mri brain injury contrast brain mri acute signal damage areas area scans imaging show perfusion image mapping

Share:

Link:

Embed:

Download Presentation from below link

Download Presentation The PPT/PDF document "1 Introduction: Traumatic Brain Injury" is the property of its rightful owner. Permission is granted to download and print the materials on this web site for personal, non-commercial use only, and to display it on your personal computer provided you do not modify the materials and that you retain all copyright notices contained in the materials. By downloading content from our website, you accept the terms of this agreement.


Presentation Transcript

Slide1

1

Introduction: Traumatic Brain Injury

Chris Rorden

Deficits associated with focal injury

Typical scanning modalitiesSlide2

2

Describing cortex location

Brodmann Areas (BAs, 1909)Appearance of cortex under microscopeNot necessarily functionArbitrary numbers are hard to rememberSlide3

3

Squirrels vs humans

squirrel brainSurface of human brain is grooved.Surface of brain from many animals is flat.If we completely flattened a squirrel brain, it would be the size of a stamp.Slide4

4

Cortical folding

Cortical folding increases surface area.Ridges are called Gyri (singular = Gyrus) Greek gyros = circle, hence a coil of brain cortexValleys are called Sulci (singular = Sulcus).Latin = a groove.Gyri

SulciSlide5

5

Anatomy

Surface of human cortex and cerebellum is very foldedFlattened, each hemisphere 1100cm2Cerebellum is also 1100cm2Crumpled shape hides size of cortexCompare Folded/Unfolded (from Marty Sereno)HumanChimpanzeeMonkeySlide6

Frontal Cortex (ch12)Prefrontal cortexDorsolateral) (DLPFC): Executive control, perseverationOribitofrontal (OFC): Inhibition, personality, OCDAnterior Cingulate: Abulia, Apathy

6Slide7

HemispheresRight Hemisphere Injury Associated with Neglect‘Dominant’ Left Hemisphere Associated with Speech and Language

7Slide8

8

Language Production

Broca’s Area (1861)Difficulty in speech productionLoss of ability to repeat speechComprehension intactFoot of 3rd frontal convolution (BA 44)Left hemisphere (1865)Except left handersSlide9

9

Language Comprehension

Wernicke’s Area (1874)Normal production (speech sounds and fluent nonsense)Sounds okay if you do not know the patient’s language (e.g. Chinese Wernicke’s aphasic would sound fine to me)Unaware of deficitImpaired comprehensionLeft hemisphereSuperior temporal gyrus(BA 42, 22)Slide10

10

Wernicke’s prediction

Predicted two language centers:Broca’s Area: speech articulation.Wernicke’s Area: language comprehension.Predicted 3rd Syndrome:Disconnection syndrome‘Conduction aphasia’Damage to arcuate fasciculusSlide11

11

Conduction aphasia

Can comprehend speechArticulation is intactDifficulty in repeating speechLesions in Temporal Parietal Junction that knock out underlying white matterPatients with damage ONLY to the arcuate fasciculus can still generate speech.Why? Other pathwaysSlide12

12

Wernicke-Lichtheim (1885) Schema

From auditory input (a) to motoric articulation of speech (m)

Broca

s Aphasia

Wernicke

s Aphasia

Concepts

(Distributed)

Conduction aphasia Slide13

13

Memory

Fornix (Squire

s Patient)

Mammillary body

(Korsakoff Patients)

Severe memory deficits seen with damage to

Papez

circuit.

Hippocampal formation - HMSlide14

14

HM’s lesion

Corkin et al. (1997) bilaterally symmetrical medial temporal pole most of the amygdaloid complex most or all of the entorhinal cortex anterior half of hippocampal formation (dentate gyrus, hippocampus, and subicular complex)Slide15

15

HM – severe anterograde amnesia

Anterograde amnesia – since lesionSuggests encoding deficitRetrograde amnesia – prior to lesion19451950

1955

1/9/1953

Memory

anterograde

retrogradeSlide16

Limbic systemMemory and emotions tightly coupled.Fear and reward

16Slide17

17

Anatomy of t

Patients who spontaneously confabulate tend to have orbitofrontal damage (aka damage to the ventromedial PFC).Slide18

Frontal lobe injuryPersonality Executive function, organization, problem solvingSet switching - Perseveration

18Slide19

The homonculusClear spatial mapping in gray and white matter.

19

M1: movementS1: sensationSlide20

Somatosensory CortexWoolsey and Wann (1976) examined plasticity of somatosensory cortex in mice.Normally, cortical barrels topographic map of space.If whiskers removed, mapping of remaining whiskers grows

20Slide21

21

Phantom Limbs

MEG offers evidence of reorganization.Patient lost one armWhen face is brushed, he experiences his old arm is touched. Consistent spatial mapping of face to lost limb.MEG reveals that arm and face encroach hand areaFigure below: arm hand and face regions in normal locations contralateral to intact arm, but arm and face representation have grown together contralateral to lost limb. For review Ramachandran and Hirstein (2000), Brain, 121, 1603-1630

Arm

Hand

FaceSlide22

22

Is plasticity reversible?

Sirigu et al. (Nature Neuroscience, 4, 691-692). CD lost both hands in 1996 Bilateral hand transplantation in 2000 Both M1 and S1 show elbow activity had taken over hand area before graft.After graft: hand area enlarges and elbow representation shrinks.Slide23

23

Thought experiment

What brain injury leads to visual field injury?Slide24

24

Mapping Lesions

With MRIcron it is easy to trace injured area.We can create an overlay plot of damaged region.For example: here are the lesion maps for 36 people with visual field defects:Slide25

25

The problem with overlay plots

Overlay plots are misleading:Highlight areas involved with task (good)Highlight areas commonly damaged (bad)Brain damage is not random: some brain areas more vulnerable. Overlay plots highlight these areas of common damage.Solution: collect data from patients with similar injury but without target deficit.Slide26

26

Value of control data

Solution: collect data from patients with similar injury but without target deficit:Slide27

27

Statistical plots

We can use statistics to identify areas that reliably predict deficitE.G. Damage that results in visual field cutsSlide28

Acute brain imagingStructural and perfusion imaging techniques used at admission.Designed to be fast, does not require conscious patient.In contrast, functional measures require participation and typically have long duration (future lectures).

28Slide29

29

CT versus MRI scans

CTClinically crucial:Detect acute hemorrhageCan be conducted when MRI contraindicated Limited research potentialExposes individual to radiationDifficult to collect control dataTypically very thick slices, hard to normalizeLittle contrast between gray and white matter

MRI

Different contrasts (T1,T2, DWI)

No radiation, so we can collect thin slices if we have time.Slide30

Xrays and CTsingle contrast mechanism: how well does tissue attenuate rays.Air ~transparent, bone ~opaque, soft tissue ~translucentThe only way to influence Xray contrast is to change tissue. E.G. injection of radio-opaque Gd into bloodstream

30

Analogy: overhead projector ~ Xray

CT: reconstructed from series of

XraysSlide31

CT TermsComputerized Axial Tomography (CAT/CT) measured Xray attenuation.Hyperintensity: Bright spotHypointensity: Dark spotFor CT (but not MRI) you can say ‘density’ instead of ‘intensity’‘W’/‘Window Width’ describes contrast setting for display‘C’/’L’/‘Window Center’/’WindowLevel’ describes brightness setting for display

31Slide32

32

Image Center/Width

How do we view an image that has higher resolution than our computer screen?Panning changes the ‘image center’.We will not see some of the image.Zooming changes the ‘image width’.We may lose details.

Pan

ZoomSlide33

33

Intensity Center/Width (Brightness/Contrast)

Adjust brightness ‘window center’E.G. range -64..124 makes muscles gray, 114..302 shows kidneysC/W 30/188 vs C/W 208/188Adjust contrast ‘window width’E.G. range -64..124 shows muscles, -400..596 shows full range.C/W 30/188 vs C/W 98/996CT intensity is calibrated (kidneys always ~208 Hounsfield units)Air -1000Water 0White Matter 25Gray Matter 40Bone 1000

Pan

ZoomSlide34

CT PerfusionCT can be enhanced with a contrast agent.For example, Gadolinium (Gd) injected into the blood stream. Gd is radio-opaque.Can show areas of reduced, delayed or slowed flow.Acute mismatch of perfusion and injury shows tissue that can be salvaged.

34Slide35

Major Cerebral ArteriesInjury not random: common patterns to stroke and TBI.

35

de Lucas E M et al.

Radiographics

2008;28:1673-1687

©2008 by Radiological Society of North AmericaSlide36

CT Signs of TBIHematoma: pooled bloodContusion: swelling, bruising. EDH: epidural hematomaDAI: diffuse axonal injurySDH: subdural hematoma,SAH/IVH: subarachnoid and intraventricular hemorrhage.

36Slide37

Magnetic Resonance Imaging (MRI)MRI uses strong magnetic field and radio signals to acquire image.Analogy: Low energy state for compass needle is North, but tap briefly knocks out of alignment.Likewise, hydrogen atoms align to field. Radio signal knocks them out of alignment, they echo radio signals while they return to alignment.

37Slide38

38

Conventional MRI scans

T1 (anatomical): fast to acquire, excellent structural detail (e.g. white and gray matter).T2 (pathological): slower to acquire, therefore usually lower resolution than T1. Excellent for finding lesions.

T1

T2

T2

T1

CSF

Bone

Air

Air

CSF

WM

GM

GM

WM

Fat

edemaSlide39

39

Lesion mapping: T1 vs T2

T1 scans offer good spatial resolution.T2 scans better for identifying extent of injury, but poor spatial resolution.Solutions:Acquire chronic T1 (>8 weeks)Acquire both T1 and T2, use T2 to guide mapping on T1.Acquire T2, map on normalized iconic brain (requires expert lesion mapper).Aquire high resolution T2 image, use for both mapping and normalization (e.g. 1x1x1mm T2 ~9min). Requires latest generation MRI. Note: Many clinicians like FLAIR as it attenuates CSF. Lesion signal similar to T2. Normalization tricky (thick slices, no standard template).

T1

T2

FLAIRSlide40

40

Imaging acute stroke

T1/T2 MRI and x-rays can not visualize hyperacute ischemic strokes.Acute: Subtle low signal on T1, often difficult to see, and high signal (hyperintense) on spin density and/or T2-weighted and proton density-weighted images starting 8 h after onset. Mass effect maximal at 24 h, sometimes starting 2 h after onset.Subacute (1 wk or older): Low signal on T1, high signal on T2-weighted images. Follows vascular distribution. Revascularization and blood-brain barrier breakdown may cause enhancement with contrast agents.Old (several weeks to years): Low signal on T1, high signal on T2. Mass effect disappears after 1 mo. Loss of tissue with large infarcts. Parenchymal enhancement fades after several months.www.strokecenter.org/education/ct-mri_criteria/

www.med.harvard.edu/AANLIB/

T2

CT

acute

+3daysSlide41

41

Imaging Hyperacute Stroke

T1/T2 scans do not show acute injury. Diffusion and Perfusion weighted scans show acute injury:Diffusion images show permanent injury. Perhaps good predictor of eventual recovery.Perfusion scans show functional injury. Best correlate of acute behavior.Difference between DWI and PWI is tissue that might survive. Diaschisis: regions connected to damaged areas show acute hypoperfusion and dysfunction.Hypoperfused regions may have enough collateral blood supply to survive but not function correctly (misery perfusion).

T2

DWSlide42

42

Perfusion imaging

Allows us to measure perfusionStatic images can detect stenosis and aneurysms (MRA)Dynamic images can measure perfusion (PWI)Measure latency – acute latency appears to be strong predictor of functional deficits.Measure volumePerfusion imaging uses either Gadolinium or blood as contrast agent.Gd offers strong signal. However, only a few boluses can be used and requires medical team in case of (very rare) anaphylaxis.Arterial Spin Labelling can be conducted continuously (CASL). Good CASL requires good hardware. Slide43

MRI versus CTMRI disadvantages:ExpensiveSlow to acquirePoor bone contrast

43

MRI advantages:

No ionizing radiation

Many contrast modalities

Some acute modalitiesSlide44

T2 vs SWI for micro-hemorrhageSusceptibility weighted imaging shows venous blood useful for microbleeds, DAI

44Slide45

Diffuse Axonal ImagingSWI and GRE images of individual with DAI

45