PPT-3.2 Spatial distribution differences
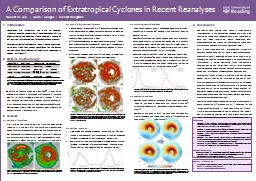
Fig 2 shows the largest spatial differences occur between the older JRA25 reanalysis when compared with the newer high resolution reanalyses ERAInterim top particularly
Download Presentation
"3.2 Spatial distribution differences" is the property of its rightful owner. Permission is granted to download and print materials on this website for personal, non-commercial use only, provided you retain all copyright notices. By downloading content from our website, you accept the terms of this agreement.
Presentation Transcript
Transcript not available.