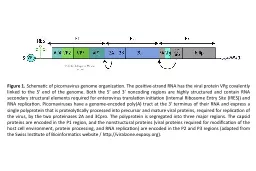
Schematic of picornavirus genome organization The positive strand RNA has the viral protein VPg covalently linked to the 5 end of the genome Both the 5 and 3 ID: 497318
Download Presentation The PPT/PDF document "Figure 1." is the property of its rightful owner. Permission is granted to download and print the materials on this web site for personal, non-commercial use only, and to display it on your personal computer provided you do not modify the materials and that you retain all copyright notices contained in the materials. By downloading content from our website, you accept the terms of this agreement.
Slide1
Figure 1.
Schematic
of
picornavirus
genome
organization
. The positive-
strand
RNA has the viral
protein
VPg
covalently
linked
to the 5′ end of the
genome
.
Both
the 5′ and 3′
noncoding
regions
are
highly
structured
and
contain
RNA
secondary
structural
elements
required
for
enterovirus
translation initiation (
Internal
Ribosome Entry Site (IRES)) and RNA
replication
.
Picornaviruses
have a
genome-encoded
poly(A) tract
at
the 3′ terminus of
their
RNA and express a single
polyprotein
that
is
proteolytically
processed
into
precursor
and mature viral
proteins
,
required
for
replication
of the virus, by the
two
proteinases
2A and 3Cpro. The
polyprotein
is
segregated
into
three
major
regions
. The
capsid
proteins
are
encoded
in the P1
region
, and the
nonstructural
proteins
(viral
proteins
required
for modification of the host
cell
environment
,
protein
processing
, and RNA
replication
) are
encoded
in the P2 and P3
regions
(
adapted
from
the
Swiss
Institute of
Bioinformatics
website
/ http://
viralzone.expasy.org
).Slide2
TD21
TD7
0
28
TD30
TD49
800
ng
of
in vitro
transcribed RNA
HeLa S10 Cytoplasmic extract ATP
6 hours
of incubation
at 30°C
Visualization of proteins synthesized on polyacrylamide gel
[35S]-methionine
Wild-type
strains
Terminaly
d
eleted
strains
3CD
VP3
2A
3AB
3Dpol
VP1
2C
Figure 2.
In vitro
translation assay. After 6h of incubation at 30°C of viral RNA in the presence of a cytoplasmic extract of
HeLa
S10 cells and
35
S-labeled methionine, synthesized viral proteins (most significant are indicated to the right of the gel) are observed after migration on a SDS-Page gel.
Slide3
rLuciferase
activity
B- HCM
C- HL-1
cells
Control
Control
Wild-type
strains
Deleted
strains
P1
region (capside proteins) Rluc
Inserting deletionsA
Figure 3. Construction and transfection of luciferase replicons into two types of cardiac myocytes. (A) The replicon consists of the viral genome in which the region encoding the capsid proteins (P1) was replaced with the gene encoding Renilla luciferase (kindly provided by Dr. F.J. Van Kuppeveld
, Virology Division, Department of Infectious Diseases and Immunology, Faculty of Veterinary Medicine, Utrecht University, the Netherlands). Deletions of 7 to 49 nucleotides have been inserted at the 5 'end of the viral genome. Replicons were then transfected (B) in primary human cardiac myocytes or (C) in a continuous cell line of murine cardiac myocytes from an atrial tumor. Luciferase activity was measured at 2 hours post-transfection. Full-length replicons are indicated in blue and deleted replicons in red. Slide4
rLuciferase
activity
HCM
Control
2 Logs
HL-1
Control
2 Logs
Translation
-RNA
+RNA
3D
pol
Transfected
RNA
Luciferase
signal amplification
A
B
C
Wild-type
viruses
Deleted
viruses
Figure 4
. Luciferase activity compared between full-length and deleted replicons. Non-deleted replicons in blue and deleted replicon in red were transfected (A) in primary human cardiac
myocytes
or (B) in murine
cardiomyocytes
. Luciferase activity was measured from 2 to 8 hours post-transfection. The results presented are the product of three independent experiments. (C) Schematic representation of luciferase signal amplification mechanism by replicating transfected viral RNA.
Slide5
PV1
TD21
TD7
0
28
TD30
TD49
Positive RNA
Double-
stranded
RNA
+
-Deleted strains
Wild-type strainsPositive controlFigure 5. In Vitro
replication assay of the viral RNA. Six hours after in vitro translation in the absence of [35S]-methionine, the reaction mixture consisting of viral RNA (400 ng for the CVB3 wild-type strains and poliovirus; 400 and 800 ng for the deleted CVB3 strains) and
HeLa S10 cytoplasmic extract was incubated for further 2h at 34C in the presence of α-[32P] CTP. The purified RNA was then loaded on an agarose gel at 1.1%. Poliovirus 1 (PV1) is used here as a positive control. Slide6
rLuciferase
activity
A- HCM
2 Logs
B- HL-1
2 Logs
C- HCM
Control
D- HL-1
Control
TD7
TD30
TD21
TD49
CV-B3 0
CV-B3 28
Without
guanidine hydrochloride With
guanidine hydrochlorideWild-type strains
Deleted
strainsFigure 6.
Impact of guanidine hydrochloride treatment on the luciferase activity measured after transfection of human and murine cardiac myocytes
with deleted and not deleted replicons. Full-length (A and B) and deleted (C and D) luciferase replicons were transfected into human (HCM) (A and C) and murine (HL-1) (B and D) cardiac myocytes. Guanidine hydrochloride at a final concentration of 3 mM was added or not to the cell culture medium 30 minutes after transfection of the replicons. Luciferase activity was then measured from T0 to T8H post-transfection in the GuHCl
treated (in red) or untreated (blue) cells. The results presented here are the product of three independent experiments. Slide7
28
TD7
TD21
TD30
TD49
28
TD7
TD21
TD30
TD49
28
TD7TD21TD30TD49
+
strand- strand
Viral load in genomic RNA copy/ml of cell medium65552.4
1.5231.4
1.41.53.224h PI48h PI0h PI
Figure 7. Quantification by one step RT-qPCR of positive- and negative-strands of viral RNA in a kinetics of infection of primary human cardiac myocytes. The full-length CVB3-28 and CVB3 viruses deleted of 7, 21, 31 and 49 nucleotides used to achieve this infection were produced on human
hepatocarcinoma cells Huh7.5 defective for type I interferon response. Cardiomyocytes infected in triplicate were collected at 0, 24 and 48 hours post-infection in 2 ml of cell culture medium after three cycles of freezing/thawing. Load of positive- (blue) and negative-strand (orange) of viral RNA is shown on the y-axe as the number of RNA copies per ml of cell culture medium. Slide8
3’ end
2C
A
B
Figure 8.
Schematic representation of cellular proteins (PCBP2,
hnRNPC
) and viral proteins (2C, 3AB, 3CDpro, 2BC) binding (A) the 5’ end of the viral genome in order to prime the synthesis of the negative-strand
antigenomic
RNA and (B) the 3' end of the
antigenomic
negative-strand for the synthesis of positive-strand genomic RNA. Slide9
28
0
TD30
PV1
Positive control
TD7
TD49
250
500
1000
ng
of PCBP2RNA alonePV1
1
2
3
4123
41234
14
123
412
3
4
1
34
Figure 9. RNA mobility shift assay of full-length (0 and 28) and deleted positive-strand viral RNA (TD7, TD31 and TD49) in the presence of the cellular protein PCBP2. A RNA fragment of 110 nucleotides located at the 5’ end of the genomic positive-strand viral RNA (stem-loop I or clover-leaf) was transcribed with
32P-CTP and incubated in the absence (free probe=FP; lines 1)
or in the presence of 250 (lines 2), 500 (lines 3) and 1000
ng (lines 4) of
the protein PCBP2. The formation of a ribonucleoprotein complex (indicated by the black arrows) results in a migration delay of the radioactive nucleic acid probe on the
agarose
gel. The stem-loop IV of poliovirus 1 IRES was used as positive control for PCBP2 experiments. Slide10
Figure 10.
RNA mobility shift assay of full-length (strain 28) and deleted positive-strand viral RNA (TD7, TD21, TD31 and TD49) in the presence of the viral protein 3CD. A RNA fragment of 110 nucleotides located at the 5’ end of the genomic positive-strand viral RNA (stem-loop I or clover-leaf) was transcribed with
32
P-CTP and incubated in the absence (free probe=FP) or in the presence of 50, 100, 150, 250, 500 and 1000
ng
of the viral protein 3CD. The formation of a
ribonucleoprotein
complex (indicated by the black arrows) results in a migration delay of the radioactive nucleic acid probe on the
agarose
gel.
501501002
50
5001000
FP50150
100250500
1000FP50150
100250
5001000
FP
50
150
100
250500
10
00
FP
50
150
10
02505001000
FP28TD30TD7TD49
TD21Slide11
Figure 11.
RNA mobility shift assay of full-length (strain 28) and deleted negative-strand viral RNA (TD7, TD21, TD31 and TD49) in the presence of the cellular protein
hnRNPC
. A RNA fragment of 750 nucleotides corresponding to the 3’ end of the
antigenomic
negative-strand viral RNA was transcribed with 32P-CTP and incubated in the absence (free probe=FP) or in the presence of 100, 250 and 500 of the recombinant protein
hnRNPC. The formation of a ribonucleoprotein
complex (indicated by the black arrows) results in a migration delay of the radioactive nucleic acid probe on the agarose gel.
28
TD30
TD7
TD49
TD21
Free Probe100250
500
Free Probe100
250500
Free Probe100250
500Free Probe
100
250
5
00Free Probe
100
250
500