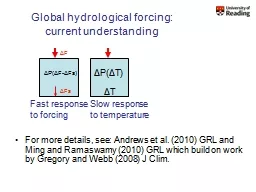
For more details see Andrews et al 2010 GRL and Ming and Ramaswamy 2010 GRL which build on work by Gregory and Webb 2008 J Clim Δ T Δ P Δ T Δ P Δ F Δ Fs Fast response to forcing ID: 656535
Download Presentation The PPT/PDF document "Global hydrological forcing: current und..." is the property of its rightful owner. Permission is granted to download and print the materials on this web site for personal, non-commercial use only, and to display it on your personal computer provided you do not modify the materials and that you retain all copyright notices contained in the materials. By downloading content from our website, you accept the terms of this agreement.
Slide1
Global hydrological forcing: current understanding
For more details, see: Andrews et al. (2010) GRL and Ming and Ramaswamy (2010) GRL which build on work by Gregory and Webb (2008) J Clim.
Δ
T
Δ
P(
Δ
T)
Δ
P(ΔF-ΔFs)
Fast response to forcing
Slow response to temperature
ΔF
Δ
FsSlide2
Global hydrological forcing: current understanding
Is there evidence of discrepancy between models and observations
What is the physical basis for changes
Δ
T
Δ
P(
Δ
T)
ΔP(ΔF-Δ
Fs)
Fast response to forcing
Slow response to temperatureΔ
F
Δ
Fs
Δ
T
Δ
P
?Slide3
Anticipated changes in the hydrological cycle
Radiative constraint: dP/dT~2-3%/K (e.g. Allen and ingram, 2002, Nature)
Radiative forcings and fast responses: how much can this change the dP/dT response? (e.g. Andrews et al. 2010 GRL)
Moisture constraint:Increases in extreme precipitation (7%/K?)Amplification of P-E patterns
(e.g. Held and Soden, 2006)Slide4
Yu and Weller (2007) BAMS
(Wentz et al. 2007, Science)
Are models underestimating current precipitation/evaporation responses?Slide5
Min et al. (2011) Nature
ALL ANT OBS
http://www.nature.com/nature/journal/v470/n7334/full/nature09763.html
Are models underestimating response of extreme precipitation?Slide6
Allan et al. (2010) Environ. Res. Lett.
Are models underestimating response of extreme precipitation?
Tropical oceansSlide7
Zhang et al. 2007 Nature
Do models underestimate regional responses?Slide8
Contrasting precipitation response in wet and dry regions of the tropical circulation
Updated from Allan
et al.
(2010) Environ. Res. Lett.
descent
ascent
Models
Observations
Precipitation change (%)
Sensitivity to reanalysis dataset used to define wet/dry regionsSlide9
Changes in tropical circulation?
Wind-driven changes in sea surface height Merrifield (2011) J
Climhttp://journals.ametsoc.org/doi/abs/10.1175/2011JCLI3932.1Increases
in satellite altimeter wind speed? Young et al. (2011) Science
http://www.sciencemag.org/content/332/6028/451.fullSlide10
Observed Precipitation trend in mm/day per year over the period 1988-2010
Top:
Trend due to changes in the atmospheric circulation
Bottom: Residual trend unrelated to atmospheric circulation changesSlide11
Interannual
changes in tropical precipitation (mm/day) in climate models & observations since 1979
Top: tropical landBottom: All tropicsSlide12
Optional:
Global changes in water vapour
Updated from O’Gorman et al. (2012) submitted; see also John et al. (2009) GRLSlide13
WP3: Exploiting satellite observations
We are currently assessing and exploiting satellite and gauge-based estimates of precipitation
Liu and Allan (2011) submittedSlide14
WP3: CMIP5 comparisons
Chunlei LiuSlide15
dP
%
/dTs
P
% trend
GPCP vs CMIP5 models
Wettest 30% of tropical gridpointsSlide16
Simulated/observed precipitation fingerprints
Stronger ascent
Stronger ascent
Warmer surface temperature
Model biases in warm, dry regime
Strong wet/dry fingerprint in model projections (below)Slide17
Moisture transports from ERA Interim
Zahn and Allan (2011) JGR
Instantaneous field
outflux
influx
Moisture transport into tropical ascent region
Significant mid-level outflow
Plans: generate budgets & compare E-P/ocean salinity