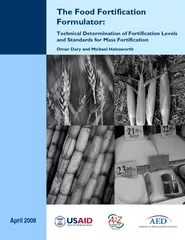
/
The FoodFortification and Standards for Mass Fortification The FoodFortification and Standards for Mass Fortification

The FoodFortification and Standards for Mass Fortification - PDF document

min-jolicoeur
min-jolicoeur . @min-jolicoeur
Follow
450 views
Uploaded On 2015-07-23

The FoodFortification and Standards for Mass Fortification - PPT Presentation

April 2008 is made possible by the generous support of the American terms of Cooperative Agreement No GHSs and the Academy for Educatnecessarily reflect the views of USAID or the United States Gov ID: 91506

April 2008

Share:

Link:

Embed:

Download Presentation from below link

Download Pdf The PPT/PDF document "The FoodFortification and Standards for ..." is the property of its rightful owner. Permission is granted to download and print the materials on this web site for personal, non-commercial use only, and to display it on your personal computer provided you do not modify the materials and that you retain all copyright notices contained in the materials. By downloading content from our website, you accept the terms of this agreement.


Presentation Transcript

The FoodFortification and Standards for Mass Fortification April 2008 is made possible by the generous support of the American terms of Cooperative Agreement No. GHSs and the Academy for Educatnecessarily reflect the views of USAID or the United States Government. ACKNOWLEDGMENTS by Omar Dary, Food FortifA2Z, the USAID Micronutrient and Child Blindness Project. Michael Hahis expertise and skills to make this Excel Hainsworth are staff members of the Academy for Educational Development (AED), in The Formulator is based mainly on the recommendations of the WHO/FAO Fortification with Micronutrients (Lindsay A, de Benoist B, Dary O, Hurrell R (Eds), 2006). The Formulator was originally conceived in a teEast, Central and Southern Africa (ECSA) Health Community, with the participation of Swaziland, Uganda, Tanzania, Zambia, and Zimbabwe, with the support of the USAID-funded MOST Project, in Lilongwe, Malawi, in 2005. The first version of the Formulator (called at the time the Food Fortification Calculator) was r ECSA meeting in Arusha, Tanzoccasion, the Formulator supported the decision of the ECSA countries to establish common guidelines of mass fortification to be recommended to the member countries. Thus far, this tool The same first version of the Formulator was presented and comments received from the Focal l American countries (Costa Rica, El Salvador, Guatemala, Honduras, Nicaragua, and Panama) in a technical meeting organized by the Project of Food Fortification as a Regional Public Health Initiative (implemented by the Central American Foundation of Food and Nutrition –FANPAHO/WHO, CDC, Project Healthy Children, and the March of Dimes), in Guatemala City, Guatemala, in November 2007. The Formulator was also applied in Chile inevaluation of its wheat flour fortification program. The name of the program, as well as part of the overall framework was inspired by the spreadsheet titled the “ CSHGP Lives Saved calculator” and used by the Child Health Epidemiology Reference Group or CHERG (aThis computational program may still have errors and can be improved. Thus, we would appreciate the users to send comments, corrections and suggestions to Omar Dary, A2Z, at odary@aed.org. Academy for Educational Development (AED), 1825 Connecticut Avenue, NW, Introduction 5 I. Overview of Mass Food Fortification 5 II. The Importance of Mass Fortification 7 III. Ten Steps in Designing Mass Fortification Programs 9 hicle for Mass Fortification 9 Step 2: Defining the Dietary Objectives 9 ination of the Food Vehicles 11 Step 4: Estimating Usual Intakes of the Fortification Vehicles 12 Step 5: Determining the Feasible Fortification Levels (FFL) 14 Allowable Cost 15 tional Impact/Selecting the Levels of Addition 15 Step 8: Estimating the Production Parameters 16 Step 9: Calculating the Regulatory Parameters 17 Step 10: Formulating the Premix 18 IV. Food Fortification Formulator 19 A. Description of the Formulator 19 B. Special Features of the Formulator 20 C. Instructions for the Use and Interpretation of the “Formulator” 22 1.) Introduction 22 2.) Summary 22 3.) Inputs 23 4.) Selecting Levels 24 5.) Fortification Parameters 25 6.) Premix Formulation 26 7.) Food Intake 27 8.) Technical Information 28 9.) EAR Values 28 10.) RNI Values 29 11.) UL Values 29 12.) Conversion Factors 29 13.) Price of Fortificants 29 14.) Intrinsic Micronutrient Contents 29 15.) Fortification Formulas 29 This document summarizes the importance of mass food fortification and provides the reader with step by step instructions for designing and implemenprograms. The document also explains how to use the “Food Fortification Formulator”, a tool which assists in determining the potential additional intakes of micronutfollowing efficacious and safety comparisons; the costs associated with food fortification programs; the fortification levels that can be used as technical specifications in the factories as well as the national standards and regulations; and the amount of fortificant to be added in the micronutrient premixes. Fortificants are defined here as the source of micronutrients, while micronutrient premixes are the blends of those fortificants with other ingredients to make them suitable to be added into the fortification vehicles. ent of essential micronutrients benefit with minimal risk to health (WHOof food fortification, which refers specifically to the addition of one or more vitamins and/or minerals to processed foods that are commonly consumed, such as flours, oils and condiments. Governments generally instigate, design, mandate, and regulate mass cation is being promoted as ththe most favorable cost benefit to prevent the physiological and clinical consequences associated with micronutrient deficiencies. Although this statement may be true inAdequate manufacturing and industrial settings which ensure cost effective Compatibility of fortificants (the source of micronutrients) with thAffordability of additional costs resulting from the fortification process for consumers and manufacturers Confirmation of the quality of Reliable enforcement actions by government authorities to assure compliance of Legitimate and justifiable food labeling and nutrition and health claims that promote healthy practices The biological impact of food fortification depends on: The amount of additional intake of micronutrients that are low in the diet; of the provided micronutrients; and The magnitude of the nutritional gap to be filled. Helping the at-risk population reach the biological efficacious threshold of micronutrient intake through the consumKeeping the intake below levels that may cause adverse effects due to excesses on rtified food in large amounts. Mass fortification consists of the addition of micronutare commonly consumed by the general publicfats, milk, sugar, and condiments. Targeted fortificationpopulation subgroups, such as complementinstitutional programs such as those aimed at pre-school and school-aged children, and foods used under emergency situations. purpose of attracting consumers and increasing sales. The addition of micronutrients to industrially manufactured fssing; imitation of the nutritional values of foods that in age groups; improve nutritional is a human invention that is improving the health and the well being ofcharacteristics is important so that better use can be made of this intervention. Countries are often faced with the challenge of determining which levels of nutrients are both efficacious and safe for the population at large. In the past, efficaciousness received the most nutritional risk. An accumulation design, plan, implement, monitor, and evaluate food fortification programs from a psame publication describes a procedure for estima for mass fortification. Although the methodology is relatively simple, it may be challenging and confusing because of the use of multiple variables in different areas, including: public health nutrition, food standards, food control practices, food inspection, and cost estimations. The “Food Fortification Formulator” is a practical tools designed to make the methodology easy to follow and apply. This tool focuses primarily on mass fortification, but may be useful for other types of fortification with some adaptations IMPORTANCE OF MASS FORTIFICATION of the complexity of human is conceptualized as simply the supply of foods to provide metabolic energy. The term “hidden hunger” was coinof essential micronutrients. Cemakers in the field of food production and human dietary neede importance of micronutrient deficiencies. There are others, however, who advocatgnores the fact that health is associated with keeping the metabolic equilibrium (homeostasis) of many substances in human Most micronutrients are only obtained through the diet because the human physiology cannot synthesize them. Those are , which are complex substancesorganisms, and mineralsWater soluble vitamins are needed for many metabolic reactions, as for example: for destroying undesirable molecules inside ththe own human biomolecules for catalyzing changes associated with amino acids for participating as coenzymes in specific reactions as the main recycling substrate involving transference of methyl groups (one carbon moieties) during the synthesis of nucleicbiomolecules fats, as for example: , which act as gene expression modulators, and the former also as the as the main antioxidant for fats as a participant of thβ-carotene as an antioxidant and as a precursor of vitamin A Minerals are also essential nutrientszincions catalyzed by many enzymes. electrons taken from the foods during the prmagnesiumelectric charges at both sides of biomembranes and to maintain the correct osmotic pressure Human metabolism is able to synthesize some niacina from amino acid trypthophan. Human metabolism is able to synthesize vitamin D from dehydrocholesterol and skin exposure to ultraviolet light. , another inorganic molecule, forms part genetic storage and expression), membrane phosp is essential for basic thyroid hormones is associated to protective antioxidant functions. This list of minerals and vitamins, and their complexity of human metabolism, and to emphasize that all of them must be present in the correct amount for optimal functioning of the human body. The description of their functions also shows that these substances are not inert; they are very active molecules, and that is why inappropriate amounts of them in the body, eithered in so minute amounts that they are known as micronutrients. Other living organisms also need some of them in small quantities; therefore, the micronutrients may not be abundant in thr example, iron, zinc, vitamin B-2, vitamin B-12, vitamin A, and vitamin D, are provided mainly through foods of animal origin. Only a few sea animals and plants contain significant amounts of iodine. Vitamins B-1, niacin, folate, B-6, and vitamin C may be low in diets wlcium, although not strictly a mithe diet contains insufficient amounts of milk and milk products. The previous list is not complete; it should also include some aminot synthesized by the human body but whose study and nutritional interventions are generally not included among the micronutrients, mainly because they form part of macromolecules or supramolecular structures. The list is also lacking of less known substances, mainly from the vegetable kingdom, whose properties in human physiology still need to be revealed. In developing countries, micronutriintake of animal products is minimal. Likewise, poor sectors of wealthy countries may also have poor diets even in combination with abundant the provision of many micronutrients because of the large dependence of the food industry on mins and minerals. ll short of meeting the daily recommended intakes of many micronutrients. In poorby systemic infectious and parasitic diseases that reduce nutrThus, incorporating vitamins and minerals that are present in low amounts in the diets into widely consumed foods has become one of thconsequences of their deficiencies for both poor micronutrients to add may vary from country to country because the epidemiological realities are available to make an informed decision for designing efficacious and safe food fortification programs. Mass fortification can be a verybut the planning, design, implemenobable risks minimized. The Food Fortification Formulator is a tool to helpThe following steps are necessary for the design of mass fortification programs. They were modified and adapted from the WHO/FAO quick summary of what is needed for designing safe and efficacious mass fortification programs. Vehicle for Mass FortificationFoods that are candidates for mass fortification should be industrially produced and consumed in adequate amounts by large segments of the population. They should also comply with the following requirements: Efficacy studies demonstrate that .the fortified foods have the potential of being s that the human needs; i.e. fortified foods are biologically efficacious The combination of the food and the forogically compatible fortification does not modify adverselcharacteristics of the foods for the customary uses, and the fortificants maintain their stability during the marketing time of tht separate from the food matrix. The fortification process is economically viable , i.e. the increment in the price due to umers and the food industry under the usual government authorities that enforthe gaps in micronutrient intakes. Even without detailed information of the diet, some initial objectives can be formulated based on the knowleconsume little to no seafood, meat, or dairy prodnutritional intervention programs, some values are suggested in intervention is established, monitoring and evaldietary information that would be applicable to refine the formulation of the fortification program. Allen, L., de Benoist, B., Dary, O. & Hurrell R. (2006) WHO/FAO Guidelines on Food Fortification with Micronutrients. WHO: Geneva, Switzerland. 341 p. . Suggested nutritional objectives for increasing micronutrient intakes in developing 100 % EAR 80% EAR 60% EAR 40% EAR Iodine Vitamin A Vitamin B-2 Vitamin B-1 - Folate Calcium Niacin - Vitamin B-12 (Vit. D)* Vitamin B-6 - Iron - Vit. C - Zinc - - *In locations where skin exposure to sun light is low. presents the objectives in terms of the Estimated Average Requirement (EARbelow the EAR for a given nutrient corresponds to that nutrient. The RNI values are more appropriaoff point method works reasonably well for mostthe consumption of the fortified food, it also onal intake in terms of RNI, as well as the absolute amounts. Another objective of mass foTolerable Level of Intake (UL) for those nutrients that might have some adverse effects if consumed in excessive amounts, such as vitamin A, vitamin D, niacin (if using nicotinic acid) zinc, calcium, fluoride, and iodine. It is important to point out here, that UL are not to be recommended levels of intake it is important to check the intakes of the mentioned micronutrients by the most vulnerable group. Susceptibility depends on the micronutrient, but in general the two groups at risk are children 4 to 6 years old and males 14 to 18 year different than those of the rest of the family, EAR is the average (median) daily nutrient intake level estimated to meet the needs of half the healthy individuals in a particular age and gender group. RNI is the daily intake that meets the nutrient requirements of almost all apparently healthy individuals in an age- and sex-specific population group. It is set at the EAR plus two Standard Deviations. UL is the highest average daily nutrient intake level that is unlikely to pose risk of adverse health effects to almost all (97.5%) apparently healthy individuals in an age- and sex-specific population group. Food Fortification Formulator 11 ects due to excessive intakes of micronutrients Micronutrient 4 – 6 years old Vitamin A X - Vitamin D - X Niacin as Nicotinic acid - X Folic Acid - X NaFeEDTA X - Iron - X Zinc X - Calcium - X Iodine X - Fluoride X - illustrates the position of the three main dietary parameters (EAR, RNI, and UL) inadequacy and risk of excess. Academies of Science of the USA. Dietary Reference Intakes. Applications in Dietary Assessment, 2001.Step 3: Finding the Appropriate Combination of the Food Vehicles Ideally, widely consumed products with a narrow range of consumption make the best vehicles for mass fortification because those products arefficacious levels of micronutrients generally not consumed by almost everyone in the population, and the intakes might vary depending on the age, the socio-economic group, more than one food, or more than one intervention, would be needed to fulfill the objectives of a nutritional program. Both the proportion of the EAR to satisfy the requirements and the combination. If this precaution is not applied and the formulation of only one product completes the UL for some the introduction of other mass for intervention with a mass coverage should be The formulator suggests fortification formulas according to separately and assumes that they are the main source of the added micronutrients. However, the user must adjust the micronutrient levels of those formulas downwards when a combination of fortification programs is planned in order to maximize the benefits and to reduce the risks. In developing countries, good candidates for mass foby wheat flour and maize flour. Sugar and oil are currently used to fortify a few micronutrients, mainly vitamin A. Wheat and maize flour may be seen as complementary vehicles for vitamin A, and even as the most important vehicles whenunfeasible, undesirable, or difficult. Furthermore, flours can provide many other vitamins and minerals simultaneously and should be used to their full potential to prevent and reduce many micronutrient deficiencies. Fortification formulatimay be done in combination, because cereal and flour intakes are mutually complementary. In e same population may consume simflours, but in different combinartification formulation might be common for the whole group of cereals and cereals flours as they constitute the same food group. Cereals and cereal flours are complimentary to each other. Therefore, it makes more sense to determine a common fortification formula for all of them as a grThis strategy will reduce the variation of the individual consumption of each one of these foods. Step 4: Estimating Usual Intakes of the Fortification Vehicles Ideally, the consumption profile of the fortification vehicles should be determined for each of the aphical and socio-economical groups. Food consumption and dietary intake surveys are useful for determining food intakes. However, those me Expenditure Surveys (HIES) have been proposed as a simpler way to obtain this informationhousehold food utilization and family composition. Assuming that food intake is proportional to the energy requirements, and using the requirement of adult males as the unitary reference, it is possible to estimate the food intake in terms ofhousehold consumption by the total number of adult equivalent units of each household. This calculation approximates the consumption profile the proportional energy requirements of each group and comparing with that of adult males. Imhoff-Kunsch, B., Flores, R., Dary, O. & Martorell, R. (2007) Wheat flour fortification is unlikely to benefit the neediest in Guatemala. J. Nutr. 137:1017-1022. illustrates the proportional energy intake for different groups, using adult males as the reference. To estimate the adjustment factrequirement is divided by the energy requirement of the adult males. . Energy Intake Requirements and NumberChildren (age in years) Females (age in years) Males (age in years) Parameter Requirement 700 1100 1400 17602325237523502100 2762 3000 29502450 Adjustment 0.23 0.37 0.47 0.59 0.77 0.79 0.78 0.70 0.92 1.00 0.98 0.82 Average of the values for th Average of the values for thr exports and non human consumption (often available from government and/from the total country food supply for human consumption and then divide that amount by the total population to get population consuming the food. The the overall population often approximates the median (P-50) value of intake of adult males. The estimation of the possible intakes of the other For example, if one calculates that the per capita but only 60 percent of the population has access to it, then the adjusted per capita intake of that r women is estimated, thThe minimum and maximum intake values may be determined by dividing and multiplying, respectively, the estimated P-50 values by consumption of the food in each country and for each population group. Low values would be evidence of large intake differences; for example, between urban and high socio-economic groups against rural and poor socio-economic groups. Later on, when the program is implemented and monitoring and evaluation activities are carried out, the real values can be The values for the groups 10-18 years old were calculated using the average of the specified values for the groups 10-13 and 14-18 years old. Likewise, the values for the 19-50 years old were calculated using the average of the specified values for the groups 19-30 and 31-50 years old. For example, if one assumes that the usual variattimes the value of the median, then the minimum and maximum intakes of that food for adult males would be 133/2 = 66 g/day, anThe “Formulator” estimates the permitted to modify the adult-equivalent proportions for each age grconditions of each country, as well as to apply different factors for estimating the minimum and maximum intakes. Step 5: Determining the Feasible Fortification Levels The Feasible Fortification Level (FFL) is the micronutrient content that will provide the greatest number of at-risk individuals with an adequate intake whiles of the fortified food. The FFLand the technological limits. The safe limitof the population, especially for adolescent males aare the groups most likely to reach the UL of intake consuming products used in mass safe limitces in the diet. [UL(mg/day) – intake of concern from other sources (mg/day)] Safe limititth percentile consumption (kg/day)] The “Formulator” allows the user one of the micronutrients with specified UL values, both from dietary sources as well as from other (supplementation, e.g.), and computes the adjusted UL, and in turn calculates the safe limit using all the information. The estimated safe limit then studies the fortification formula and assesses its impact in additional %EAR, %RNI, and approximation to the adjusted UL value. The safe, technological, and cost limits, as well as the deduced FFL, are computed for reference in oneTechnical Information The WHO/FAO Guidelines on Food Fortification with Micronutrients includes as part of this definition the cost . However, because the cost limit depends on the combination of all the fortificants and process costs, and it is in essence a financial decision about how to cover the program cost, it is discussed here as an independent step. The safe limit is defined as the highest average fortification level that would be feasible to use without the risk for approaching the UL, or the determined proportion of the UL if more than one food vehicle is being considered. A more accurate calculation may consider micronutrient losses during distribution and storage, as well as losses during food preparation. However, because losses vary hugely according to conditions and situations, and because premixes usually are formulated with higher amounts to compensate for these losses, we recommend using this simplified approach. Step 6: Defining the Acceptable Allowable Cost Fortification should have a low impact on the pripossibility of non-compliance or risks of corruption may hinder programmatic feasibility. Values market-driven fortification, increase in the price is not as sensitive as with mass fortifand commercial advertising. Stap in mass fortificatiumption and their use as ingredients for other If the cost of fortification is too high, then the program managers may decide to reduce the level d, or the less effective, or the most expensive fortificants. Cost is the most flexible of the limiting factors that influence the fortification level because external financing may make a fortification program more viable. Both the absolute and the relative cost of mass fortification programs. The first defines the annual overall and per person costs of the program, while the second determines the viability of the fortified food among non-fortified alternatives. The “Formulator” trient, the annual cost per consumerprocess which provides program managers with sufficient information so that they may make informed decisions. Step 7: Assessing the Nutritional Impact and Selecting the Levels of Addition The “Formulator” processes the information about the food consumption profile of the or four (flours) fortification formulas according to the level of food intake (low, medium, high, and very high consumption patterns). Each fortification formula specifies the amount of micronutrientmicronutrient levels accordingly with the objectives and the conditions of each program. The “Formulator” also uses usual losses of the micronutrients during markea raw estimation of the micronutrient level at the consumer’s table. As outputs, the “Formulator” micronutrients in terms of %EAR amounts in mg/day of each micronutrient, at the probable P-5, P-50 and P-95 percentiles of consumption. It is important to keep in mind that for designing other fortification programs, two l intake of micronutrienwhich will be used for estimating new “adjusted” ULs for the next fortified food(s) to be rcentile, which may be subtracted from the od vehicle(s) that are being considered as carriers of the same micronutrients. The “Formulator” allows the user to select other micronutrient levels of addition, and computes the different parameters with the new informati satisfied with the results. Users may select fortification levels that are lower than the FFL or the levels suggested by the “Formulator” because the patterns of ng smaller micronutrient levels, or that more than one vehicle is being considered to deliver the same micronutrient. Once the selected formula might affect the micronutrient intakes for those groups. The “Formulator” makes these calculations when the user simply switches from one populatiStep 8: Estimating the Production Parameters After selecting the fortification levels, the next step is to calculate the at production. These parameters are obtained using simple e intrinsic content of the micrthe fortification process. The parameters become the technical micronutrient in the fortified food results from the addition of the the corresponding micronutrient in the unfortified food. The minimum and the maximum fortification levels during production are estimated by means of subtracting Equations 2 and The estimated range represents the expected analytical contenThe user of the “Formulator” may change the values of the performance specifications of the the calculations to the specific conditions of production in each Minimum Fortification Level (mFL) (mg/kg) = kg) = (of the process (%/100))] Maximum Fortification Level (MFL) (mg/kg) = g/kg) = (of the process (%/100))] The WHO/FAO Guidelines on Food Fortification with Micronutrients, as well as related article (Dary O. Establishing Safe and Potentially Efficacious Fortification Contents for Folic Acid and Vitamin B-12 2008; June, in press) used 2 coefficients of variation for estimating the range that would include 95% of adequately fortified samples. However, this recommendation works only if the coefficient of variation of the fortification process is lower than 20%, and it seems that it is unrealistic for many countries. For this reason, the equations have been changed here to estimate the analytical range that would include 80% of the adequately fortified samples under the assumption that the analytical results follow a symmetric distribution around the mean. Calculating the Regulatory ParametersThe “Formulator” will also suggest the Regulatory Parameters, i.e. the legal minimumMaximum Tolerable Level ) of the fortified food for standards and enforcement purposes. The legal minimum originates frommicronutrients during the expected markcalculation. The MTL coincides with the maximum production content, and it is mainly applicable to those micronutrients with low UL values. The LmL is useful to include as the minimum content claim in the labeling of the products. It is also useful when single samples are analyzed to confirm that thfortified samples should have analytical results of the micronutfood standards for mass fortification includemicronutrients that should be added, as well as the average content of miat the LmL and the MTL are only the minimum and maximum values of the analytical allowable range when single samples are analyzed. Otherwise, the producers may aim to comply only with the LmL and will not add the amounts of micronutrients at the levels that are expected. This problem has been identified in cases, the mass fortification programs are not delivering the expected additional intakes of the needed micronutrients. Legal minimum Level (LmL) (mg/kg) = [Minimum Fortification Level (mFL) x (1 – proportion of losses during marketing)] Food Fortification Formulator 18 PRODUCTION:AveragemFL = Minimum F. levelMFL= Maximum F. LevelREGULATORY:LmL= Legal min. levelMTL=Mx. Tolerable Process a o n Average LmL Losses mFL Selectedlevel of addition Intrinsiccontent MTL relationships of the different food control parameters at are mentioned here. Parameters for Mass FortificatiFortification with MicronutrientsThe final output of the “Formulator” is the estimation of the premix composition. Each micronutrient is supplied by a fortificant, in which only a proportion of its composition is the micronutrient itself. Therefore, the amount of fortificant to add will be larger than the micronutrient content that is selected. Furthermore, in many occasions other substances in addition to the fortificants are incorporated to the premix to improve fluidity and stability. A minimum weight and volume for the combination of fortificants needs to be used to achieve the selected micronutrient levels. Consequently, there is a maximum dilution fortified food produced per a specific amount of the fortificant premix), because there is a strict minimum amount of premix to add. It is not possible to reduce that amount of the fortificant premix without decreasing the micronutrient contenmay decide to use larger amounts of premix rough better mixing. In this case, filling material is incorporated into the premix to increase its weight and volume. More diluted premixes have lower prices than concentrated premixes because their micronutrient content is lower; however, the final cost of fortification is larger because the final content of micronutrients added to the foods should be the same, but the handling and use of larger volumes of diluted premix increases the expenses. Dilution factors around 1,000 to 2,500 are customary in mass fortification. The “Formulator” allows the users to try different premix formulations, and estimate the micronutrient composition and the cost of each one of them. The micronutrient contents that are estimated by the “Formulator” should be interpreted as the minimum levels that the micronutrient premix should contain. The premix formulators should decide to add some overages (additional amounts over the minimum content) to assure that the premix contain the claimed minimum levels up to the exis important to point out here, Food Fortification Formulator 19 that the process described here does not need the calculation of overages for the fortified food, which makes easier the formulation of premixes and favors a leveled playing field for the premix manufacturers. IV. FOOD FORTIFICATION FORMULATOR A. DESCRIPTION OF THE “FORMULATOR”The “Formulator” is a spreadsheet written in the program Excel with 15 linked worksheets values and calculations. The first two worksheets are an introduction, and a summary table that includes parameters of interenutrition (additional intakes of micronutrients in absolute amounts, and percentages of EAR standards for governments, premix formulation, and costs. The worksheets are identified with a diffe: Instructions : Summary of data : Cells in yellow in other worksheet also indicate data to Clear Yellow: Data suggested by the “Formulator”: Cells in clear yellow in other wo: Output data : Reference values Some other color codes have been used in specific cells to notify the user of their importance. Thus: increase due to fortification larger than planned), the formulator warns the user : Reference data : Important calculations that are needed for making decisions 2. Summary (Green) 3. Inputs (Yellow) 5. Fortification Parameters (Blue) 6. Premix Formulation (Yellow) 8. Technical Information (Clear Yellow) 9. EAR Values (Gray) 12. Conversion Factors (from RNI to EAR) 15. Fortification Formulas (Gray) Thus far, “Formulators” have been Maize flour (without a germ) Maize meal Mesa-maize flour In the near future, similar worksheets are planned for the following foods: Powder milk Fluid milk Other foods may be added ifSome of the “Formulators” include features that are specific for each application. The Salt Formulator: The list of possible micronutrine, vitamin A, iron (from micronized ferric pyrophosphate), and fluoride. The user can use the Formulator to estimate the technical and economic implications to add these micronutrients to salt. Although the Formulator recommends potassium iodate as the source of iodine, the user can also compare the re The sheet about the Premix Formulation permits the selection between the dry method of fortification (using a dry premix of potassium imethod (using a solution of any of the iodine fortificants). The dry method may be used for all the micronutrients mentioned above, while the wet method is only In the case of the wet method of fortification, the Formulator helps in the determination of fortification conditions depending on whether the fortification is application accordingly to the rate flux of the salt production are estimated. ered; one for a per capita intake below 10 g/day (low), and the other for more thanpressure and associated chronic diseases. If in the future this recommendation is applied, only the fortification formulatiIn addition to vitamin A, the Formulator can be used to make estimations for (from NaFeEDTA and ferrous bisglycinate), and iodine (using potassium iodate). Although some of these fortifications have been d as a feasible program. Proof that the micronutrients do not segregate (separate) from the sugar crystals, as well as the e product made with it is still needed, The list of possible micronutrients to add includes vitamin D. This nutrient might be from the Equatorial line or for culturaIn the sheet for Premix Formulation, the cais estimated in addition to the amount and micronutrient content of the oily solution delivered to the unfortified oil. Refined Flours (wheat and maize flour (no germ)): The Formulator has been constructed in a way to select either the dietary parameters diet: moderate bioavailability and low Although the Formulator recommends the use of ferrous fumarate as the iron source, the user can compare the results with the lfate, and NaFeEDTA. The EAR and RNI adjusted based on experimental findings as compared with the bioavailability of fe in the literature. The Formulator also includes vitamin D in dry form, calcium carbonate, and potassium iodate for the user who wants to estimate the nutritional, technological, and economic implications of these High Extraction Flours (wheat, maize and masa-maize flour): The Formulator has been constructed to select only the dietary parameters (EAR and Although the Formulator recommends the use of NaFeEDTA as the iron source for these types of flours, the user can compare the results with the following types of iron: electrolytic, encapsulated ferrous sulfate and ferrous fumarate. Ferrous sulfate was not included because it interacts negatively with the fats and other substances The Formulator also includes vitamin D in dry form, calcium carbonate, and potassium iodate so the user can estimate the nutritional, technological, and economic implications of these otheC. INSTRUCTIONS FOR THE USE AND INTERPRETATION OF THE This first worksheet presents a short descrip the “Formulator”, and the meaning of the different colors, both for worksheets and cells. It also lists the basic information that is required from the user. Worksheet 2 summarizes the main outputs provided by the “Formulator”. The cells of the different parameters are filled with examn data into the Inputs worksheet. (e.g. females 19-50 years, or any of eleven possibilities that the “Formuwomen are not included because they require special attention); the country’s name; the of diet in terms of the bioavailability of minerals, either The first two lines of data of the page are dedicated to reporting the most important variables for a program manager. Those are: Adjusted Per Capita Intake: proportion of the population th Estimated median intake(P-50) of the target group: user, or computed by the “Formulator” following the assumptions of proportional energy intake in terms of adult equivalerequirements of the adult males, and accepting that the adjusted per capita intake approximates their P-50 intake). Cost per consumer: yearly average cost of the fortification program calculated by multiplying the estimated fortification cost by the adjusted per capita intake of : the estimated increment, ce of the foods as reported by the user. If this cell appears in red, this means that the increment in price due to fortification was higher than the value originally idenFortification Cost: a rough estimation of the probablprogram, assuming that 90 percent of the total cost is attributable to the premix Premix Cost: the estimated cost of the premix as computed by the “Formulator”. The two last columns of the table in the worksheet present details of the micronutrient and other costs. : amount of premix in grams per metric ton of fortified food as : the inverse of the amount of premix expressed in the same weight units as the fortified food. The summary worksheet also includes a table with several columns with important information for each micronutrient added to the food and classified in three categories. Thus: Nutritional EstimationsAdditional daily intakes in absolute amounts (mg/day) Average level of addition of the micronutuser as the fortification levels Production Parameters: minimum, average, and maximum levels (mg/kg) as computed by the “Formulator”, where the intrinsic content of the micronutrients in the unfortified food and Regulatory Parameters: minimum legal and maximum tolerable levels (mg/kg) as computed by the “Formulatothe usual marketing life (source of the micronutrients) Amount of fortificants (grams) per kilogram of premix Amount of micronutrients (grams) per kilogram of premix. Cost (US$/kg) for each one of the added fortificants Percent of the cost of each fortificant over the estimated total cost of the premix as computed by the “Formulator” basic input data from : Name of the country and the ffortification, respectively oup from 11 possible options : Maximum acceptable increase in the price of the food due to fortification : Number of micronutrients that arinformation would be used in the Technical Information worksheet to compute vel for each micronutrient. : Per capita intake of thnsumes or has access to the food : The “Formulator” reports here the estimated Adjusted Per Capita consuming the food. : The user should input estimated5), median (P-50), and high (P-95) levels of consumption by thgroup under analysis. The “Formulator” presents the estimations of these values worksheet named D. FOOD INTAKES, usiThe user should select if the diet r non-refined flours. If the response is YES, the “Formulator” will select the EAR and RNI values corresponding to the low bioavailable diet. Otherwise, the valuesbioavailability for minerals. timated intakes of the nutrients whose excessive intakes are a matter of concern, even from dietary sources. Those are: vitamin A, vitamin D, calcium, iodine, and fluoride. : These cells are for the estimatedexcessive intakes are a matter of concern and that are supplied from sources foods, supplements, e.g.). The micronutrients included are: vitamin A, vitamin D, niacin (only from nicotinic acid), iron , calcium, iodine, and fluoride : The “Formulator” computes the total intake of the micronutrients whose intake should not bethe “Formulator” to calculate an adjusted UL value; i.e. UL – total basal intakes. intakes) in terms of %EAR that should SELECTING LEVELS Worksheet 4 is the most important spreadsheet. It is here where the user will make decisions regarding micronutrient levels. : The “Formulator” copies the P-5, P-50, and P-95 : The “Formulator” shows the usere consumption pattern of the population. Number of categories depends on the food. Thus: 2 for salt (low and high); 3 for sugar and oil (low, medium, and high); and 4 for the flours (low, medium, high, : The “Formulator” classifies the ke value of each category. : The “Formulator” reminds the user offood, and in the case of iron using diff: The “Formulator” shows the Technological Limits of fortification for each micronutrient as specified in the TECHNICAL : The “Formulator” shows the computed Safe Limit for the micronutrients whose intakes should not be excessive. This value is estimated levels accordingly to the formulas shown in the last worksheet: FORTIFICATION FORMULAS. These values are only for reference, because the user may be considering programs integrated with several fortified foods or interventions. : The user inputs the Selectedmicronutrients in the fortified food that the program. The user analyzes the additional intakes due to the consumption of ), absolute amounts in columns P to Rcompare how much the nutritional objectives (column Humption, and how much the intake at P-95 ) comes near to the adjusted UL value (examine the preliminary cost estimations per each selected micronutrient ( The intakes of folic acid are multiplied by 1.7 for estimating the %EAR and %RNI taking into consideration the larger bioavailability of the synthetic forms than in the natural sources. These calculations take in consideration the losses of some micronutrients during marketing, as well as cooking, as assumed in the Technical Information worksheet. ). Columns C (Technological Limit) and D (Safe Limit) are used as references that may have probabilities of being intakes, respectively. FORTIFICATION PARAMETERS Worksheet 5 does not allow modi“Formulator” using the cworksheets designated as SELECTING LEVELS, TECHNICAL INFORMATION and INTRINSIC MICRONUTRIENT CONTENTS. These columns list the name of micronutrients and the fortificant compounds, respectively. The “Formulator” copies here the selected fortification level. : the expected minimum content through chemical analysis, of each micronutrient for 80 percent of adequately : the expected average micronutdetermined through chemical analysis. Thd in the worksheet named INTRINSIC MICRONUTRIENT CONTENTS, and the selected fortification : the expected maximum content through chemical analysis, of each micronutrient for 80 percent of adequately the estimated Legal minimum Level ththe adequately fortified foods even after the completion of its usual marketing time. This value is estimated using Equation 4 and may be used for labeling. : the Maximum Tolerable Level, which is the same as the maximum micronutrient level during production. This avoid supplying excessive micronutrient amounts to the population and to compel producers to achieve small variation for the fortification process. PREMIX FORMULATION Worksheet 6 helps determine the formulation of the premix. The user has the option to increase the amount of premix per metric ton reduce the dilution factor). The “Formulator” calculates the maximum dilution factor that is possible using the minimum amount of the micronutrient premix that is necessary to attain the micronutrient levels that have been selected. The “Formulator” also estimates the dilution factors if the amounts of the premix are increased by using more diluted premixes. This worksheet includes a table at the bottom that shows the estimated cost of the fortificants per metric ton of thincrease. The calculations are repeated for each premix that is being assessed. The cost of the micronutrient premix usually corres: The “Formulator” reports the minimum amount of premix (grams per metric ton of food) that is needed to attain the selected micraddition. This value is computed by addisupplies the micronutrients, and using the proportions of the micronutrient in each fortificant as specified in the worksheet named PRICE OF : The user can increase the amount of the premix with the purpose of reducing the dilution factor and improving homogeneity. The additional weight that is needed to incorporate in the micronutrient premix will be added as filling material, and it is calculated at the bottom of column F. Cells I9 and I10on factors of the micronutrient premix in the fortified food for the minimum amount of premix (maximumand for the amount of premix selected respectively. These values are computed dividing one metric ton of the fortified food by the amount of micronutrient premixsame units of weight. : These columns list the names of micronutrients and the fortificant compounds, respectively. The “Formulator” copies here thication level. : The “Formulator” computes the amount of each fortificant (source of micronutrient) that is needed in order to using the proportion of the micronutrient inworksheet PRICE OF FORTIFICANTS. The “Formulator” adjusts the amount of each fortificant (in grams) per each kilogram of micronutrient premix, and following the instructions of the user regarding the amount of premix that should be added to each metric ton of : the same information as column F but expressed in terms of the micronutrient content. : The “Formulator” computes the cost of the premix by estimating the cost of each fortificant and using the prices specified in the worksheet named PRICE OF FORTIFICANTS, and the assumed process cost that appears in the cell at the bottom with a clear yellow color. The user can modify the estimated cost of the process in the cell with the clear yellow color. : the same information as column H but expressed in terms of the percent of the total premix cost. Worksheet 7 shows how the “Formulator” estimagroup that is being analyzed. It assumes that median intake of adult males (adult equivalemulator” estimates th of the food for each one of these groups (median values). The possible P-5 and P-95 intake values are then estimated by dividing or multiplying, respectively, the factors of estimations that are shown in Cells G8as the factors to estimate the low and high fitting the estimations to the specific conditions of each country or circumstance. Worksheet 8 contains several parameters that are used for the calculations made by the “Formulator”. The user can change the values that are in cells with clear yellow color. The parameters included are: : Losses of the micronutrients during marketing as %. : Losses of the micronutrients during cooking as %. : The “Formulator” estimates an expected average of micronutrient losses before consumption. from fortificant to fortificant, is influed the food, sampling framework and sample of the specific chemical assays. : Technological Limit. The maximum amount of each micronutrient the products manufactured with it. These values should be determined experimentally, both for the fortified food as: Safe Limit: the maximum content of micronutrients that can be added to prevent reaching the adjusted UL of intake at the maximum consumption value : Cost Limit: the maximum content of micronutrients that can be added within the price increase specified in the Inputs worksheet. This is included here only as a reference parameter to be compared with the Technological and Safe Limits. Indeed, the cost limit is a function of the combination of micronutrients that are added, as well as the costs of manufacturing the premix and its i.e. the lowest value among the technological, safe and cost limits. EAR VALUES Worksheet 9 presents the estimated EAcalculated from the WHO/FAO RNI values and CONVERSION FACTORS worksheet. In the case of iron and zinc, values for moderate and low bioavailability diets are specified. Approximate figures for different types of iron compounds are also included. Worksheet 10 presents the RNI values for 11 age- and gender- groups, as recommended by WHO/FAO. In the case of iron and zinc, values for moderate and low bioavailability diets are specified. Approximate figures for different types of iron compounds are also Worksheet 11 presents the currently accepted UL values by WHO/FAO. Some of the data come from the Institute of Medicine, CONVERSION FACTORS factors as recommend by the WHO/FAO Guidelines on Food Fortification with MicronutrientsWorksheet 13 presents current prices from vitamin and mineral providers, as well as the proportion of micronutrient in each fortificant. The user can input other values. INTRINSIC MICRONUTRIENT CONTENTS Worksheet 14 shows the micronutrient content of the 8 foods for which “Formulators” Worksheet 15 suggests micronutrient levels in Column F of the worksheet with the name SELECTING LEVELS.