/
The purpose of this project was to develop a portable G-Meter, roughly the size of a cell The purpose of this project was to develop a portable G-Meter, roughly the size of a cell

The purpose of this project was to develop a portable G-Meter, roughly the size of a cell - PowerPoint Presentation

min-jolicoeur
min-jolicoeur . @min-jolicoeur
Follow
362 views
Uploaded On 2018-02-22

The purpose of this project was to develop a portable G-Meter, roughly the size of a cell - PPT Presentation

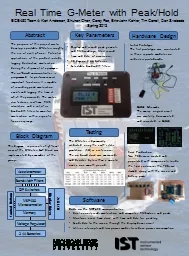
include logging destructive acceleration during the shipment of a packages The onboard microcontroller is programmed to perform several important functions It is capable of recording peak acceleration events and logging the time at which they occurred The meter ID: 634292

meter time peak acceleration time meter acceleration peak filters display bandwidth microcontroller real rms prototype final pcbs driver circuit

Share:

Link:

Embed:

Download Presentation from below link

Download Presentation The PPT/PDF document "The purpose of this project was to devel..." is the property of its rightful owner. Permission is granted to download and print the materials on this web site for personal, non-commercial use only, and to display it on your personal computer provided you do not modify the materials and that you retain all copyright notices contained in the materials. By downloading content from our website, you accept the terms of this agreement.


Presentation Transcript

Slide1

The purpose of this project was to develop a portable G-Meter, roughly the size of a cell phone. Potential applications of the product include logging destructive acceleration during the shipment of a packages.The on-board microcontroller is programmed to perform several important functions. It is capable of recording peak acceleration events and logging the time at which they occurred. The meter also features real-time RMS calculation and a set of six bandwidth filters to monitor acceleration within a specific frequency range.

Real Time G-Meter with Peak/HoldECE480 Team 4: Karl Anderson, Shuhan Chen, Corey Fox, Eric-John Kohler, Tim Carroll, Dan SvobodaSpring 2013

Abstract

Key Parameters

Initial Prototype

The first prototype was constructed in three separate modules on solderless protoboards.

Hardware Design

Block Diagram

Accelerometer

2x8 LCD

Voltage Regulator

2 AA Batteries

Memory

DIP Switches

Bandwidth Filters

Control Buttons

MSP430

Microcontroller

This diagram represents a high-level view of the G-Meter. Each block was implemented by a member of the group.

EAGLE Schematic

The messy original circuit

was carefully documented

and recreated in EAGLE.

Final Production

Two PCBs were created and populated with components. Inside the final enclosure, the PCBs are stacked along with the screen and battery pack.

Display and record peak g events and RMS readings. Must record time and date of occurrence.

30 days on 2 AA batteries

Selectable bandwidth filters

Testing

The G-Meter is dynamically calibrated using the earth’s static gravitation (1G) as a reference.

The on board clock was measured, and deviates by less than a minute over a one month period.

Display Driver

Software

Code on the MSP430 microcontroller:

Continuously reads acceleration and computes RMS values and peaks

Maintains a real time clock with time and date for peak log

Sends data to the screen through the display driver circuit

Utilizes interrupts and low power modes to reduce power consumptionSlide2

The purpose of this project was to develop a portable G-Meter, roughly the size of a cell phone. Potential applications of the product include logging destructive acceleration during the shipment of a packages.

The on-board microcontroller is programmed to perform several important functions. It is capable of recording peak acceleration events and logging the time at which they occurred. The meter also features real-time RMS calculation and a set of six bandwidth filters to monitor acceleration within a specific frequency range.Real Time G-Meter with Peak/HoldECE480 Team 4: Karl Anderson,

Shuhan Chen, Corey Fox, Eric-John Kohler, Tim Carroll, Dan Svoboda

Spring 2013

Abstract

Key Parameters

Initial Prototype

The first prototype was constructed in three separate modules on solderless protoboards.

Hardware Design

Block Diagram

Accelerometer

2x8 LCD

Voltage Regulator

2 AA Batteries

Memory

DIP Switches

Bandwidth Filters

Control Buttons

MSP430

Microcontroller

This diagram represents a high-level view of the G-Meter. Each block was implemented by a member of the group.

EAGLE Schematic

The messy original circuit

was carefully documented

and recreated in EAGLE.

Final Production

Two PCBs were created and populated with components. Inside the final enclosure, the PCBs are stacked along with the screen and battery pack.

Display and record peak g events and RMS readings. Must record time and date of occurrence.

30 days on 2 AA batteries

Selectable bandwidth filters

Testing

The G-Meter is dynamically calibrated using the earth’s static gravitation (1G) as a reference.

The on board clock was measured, and deviates by less than a minute over a one month period.

Corey’s g testing data here?

Display Driver

Software

Code on the MSP430 microcontroller:

Continuously reads acceleration and computes RMS values and peaks

Maintains a real time clock with time and date for peak log

Sends data to the screen through the display driver circuit

Utilizes interrupts and low power modes to reduce power consumption