PDF-Disclaimer: This article appeared in the AIMA Journal (Sept 2004), whi
Author : mitsue-stanley | Published Date : 2015-11-28
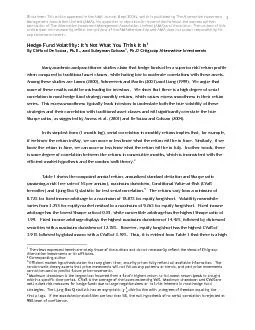
The views expressed herein are solely those of the authors and do not necessarily reflect the views of Citigroup Alternative Investments or its affiliates degrees
Presentation Embed Code
Download Presentation
Download Presentation The PPT/PDF document "Disclaimer: This article appeared in the..." is the property of its rightful owner. Permission is granted to download and print the materials on this website for personal, non-commercial use only, and to display it on your personal computer provided you do not modify the materials and that you retain all copyright notices contained in the materials. By downloading content from our website, you accept the terms of this agreement.
Disclaimer: This article appeared in the AIMA Journal (Sept 2004), whi: Transcript
Download Rules Of Document
"Disclaimer: This article appeared in the AIMA Journal (Sept 2004), whi"The content belongs to its owner. You may download and print it for personal use, without modification, and keep all copyright notices. By downloading, you agree to these terms.
Related Documents