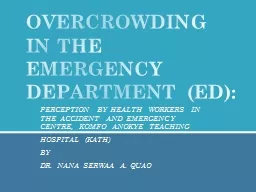
HOSPITAL KATH BY DR NANA SERWAA A QUAO OVERCROWDING IN THE EMERGENCY DEPARTMENT ED DR GEORGE ODURO DR JOE BONNEY DR PAA KOBINA FORSON COAUTHORS INTRODUCTION PURPOSE OBJECTIVE METHOD ID: 618166
Download Presentation The PPT/PDF document "PERCEPTION BY HEALTH WORKERS IN THE ACCI..." is the property of its rightful owner. Permission is granted to download and print the materials on this web site for personal, non-commercial use only, and to display it on your personal computer provided you do not modify the materials and that you retain all copyright notices contained in the materials. By downloading content from our website, you accept the terms of this agreement.
Slide1
PERCEPTION BY HEALTH WORKERS IN THE ACCIDENT AND EMERGENCY CENTRE, KOMFO ANOKYE TEACHING HOSPITAL (KATH)BYDR. NANA SERWAA A. QUAO
OVERCROWDING IN THE EMERGENCY DEPARTMENT (ED):Slide2Slide3
DR. GEORGE ODURODR. JOE BONNEY
DR. PAA KOBINA FORSON
CO-AUTHORSSlide4
INTRODUCTIONPURPOSEOBJECTIVE
METHOD
SAMPLE
RESULTS
DISCUSSION
RECOMMENDATIONCONCLUSIONREFERENCES
OUTLINESlide5
Emergency department (ED) overcrowding is gradually becoming a growing trend in many hospitals worldwide.According to a 2002 national US survey, more than 90% of large hospitals report EDs operating “at” or “over” capacity.
In a 2001
report, 91% of US ED directors (525 out of 575 directors) reported problematic crowding in their departments, and 39% reported overcrowding on a daily basis.
INTRODUCTIONSlide6
Overcrowding can be defined as “a situation in which demand for service exceeds the ability to provide care within a reasonable time, causing physicians and nurses to be unable to provide quality care”. (CAEP & NENA, 2001)
A
boarded patient is defined as a patient who remains in the emergency department after the decision to admit him or her to the hospital has been made
. (ACEP Joint taskforce, 2007)
INTRODUCTIONSlide7Slide8
INTRODUCTIONAs part of the problem-solving process, it
is important
to distinguish what crowding means
in the emergency department versus the inpatient units of most hospitals.
Inpatient
units, when their normal patient beds are full, are considered “full
” and
thus not
“capable
”
of taking more patients.
Emergency
departments
are considered
“
full
”
when
all their rooms are
full
, all their
hallway stretchers
are
full,
and
all their chairs are full
.
Thus, there
is a striking contrast between the
emergency department
and the inpatient units in
their respective
views of what constitutes “at
capacity” or
being crowded
. (ACEP Joint Taskforce, 2007)Slide9Slide10Slide11Slide12
A number of effects have resulted from ED overcrowding:Inadequate patient care
Prolonged delays in the treatment of pain and suffering
Long waiting times and patient dissatisfaction
Ambulance diversions
Decreased nurse/physician satisfaction
Negative effect on teaching and research
(Canadian Association of Emergency
Physicians and
National
Emergency Nurses
Affiliation,
CJEM
(2001
)).Slide13
KATH ED receives an average of 84 patients per day and 28,000 patients in a year.
Overcrowding
and long boarding hours has been a challenge in the EDSlide14Slide15
To assess the perception and causes of patient overcrowding among health personnel and to identify strategies to reduce overcrowding in the emergency department.PURPOSE OF THE STUDYSlide16
To determine the perception of overcrowding in the emergency department among health personnel
To identify the factors contributing to overcrowding in the emergency department
To ascertain the effects of overcrowding on patient care among health personnel
To identify strategies to reduce patient overcrowding in the emergency department
SPECIFIC OBJECTIVESSlide17
The research was submitted to the Committee on Human Research, Publications and Ethics (CHRPE) at KATH, for ethical clearance before embarking on the study (REF: CHRPE/AP/359/15).
Permission
was sought from the administrative heads of A&E Centre at KATH.
Verbal consent was sort from the health workers before participation.
ETHICAL CLEARANCESlide18
A cross-sectional study was used.The study was carried out for three months in 2015.
Analysis
was done using
Epi
Info 7 by CDC.
METHODSlide19
A total of 513 health workers (236 health workers in emergency department, (47 doctors and189 nurses), 277 health workers
in internal medicine, surgery, trauma and orthopaedics, EENT combined) work in the Emergency units of yellow, red, orange and CDU under the Emergency Department.
Systematic
sampling was adopted for this study to reduce the potential of human bias in the selection of the population to be included in the sample.
SAMPLESlide20
With a 5% margin of error and a 95% confidence interval, a sample size of 110 was obtained out of the total staff population in the Accident and Emergency Centre.
One-third
of the total number was chosen and in each department, health workers were randomly selected for the study.
Using systematic random sampling method, 110 health workers were selected.
SAMPLESlide21
Questionnaire based interviews were conducted among health workers to give their perception about patient overcrowding and its effects. Closed ended questions were administered.
The instruments for data collection were subjected to pre-testing to ascertain the validity and consistency prior to the study. No errors or ambiguities were identified after the pre-testing thus confirming the suitability of the tools.Slide22
RESEARCH QUESTIONWhat is the perception of overcrowding of patients in the emergency department among health personnel?
What
are the effects of overcrowding in the emergency department on health care personnel?
What
are the contributory factors to patient overcrowding in the emergency department?
Which strategies can be used to reduce patient overcrowding in the emergency department?Slide23
A total of 110 health workers were surveyed with 59 (53.64%) being nurses and 51(46.36%) as doctors.
Females were 52(47.27%) and males were 58 (52.73%).
All workers had attained some
level
of education with Diploma as the
most attained 41(42.27%). Majority of the respondents were residents, 21(19.44%), senior nursing officers, 20(18.52%), and house officers,
14(12.96
%).
RESULTSSlide24
VARIABLE (N)
Frequency
Percent
SEX (N=110)
MALE
58
52.73%
FEMAE
52
47.27%
AGE (N=96)
20-29
41
42.71%
30-39
49
51.04%
40-49
5
5.21%
50-59
1
1.04%
OCCUPATION (N=110)
NURSING
59
53.64%
MEDICAL DOCTOR
51
46.36%
EDUCATIONAL LEVEL (N=97)
DIPLOMA
41
42.27%
UNIVERSITY UNDERGRADUATE
3536.08%TERTIARY1111.34%POST GRADUATE77.22%MGCS22.06%CERTIFICATE11.03%
Source: Field Data, 2015
UNIVARIATE ANALYSIS OF HEALTH WORKERSSlide25
VARIABLE (N=108)
Frequency
Percent
RANK
RESIDENT
21
19.44%
SENIOR NURSING OFFICER
20
18.52%
HOUSE OFFICER
14
12.96%
SPECIALIST
9
8.33%
NURSING OFFICER
8
7.41%
MEDICAL OFFICER
5
4.63%
STAFF NURSING
3
2.78%
ENROLLED NURSE
2
1.85%
CONSULTANT
1
0.93%
RANKS OF HEALTH WORKERS
Source: Field Data, 2015Slide26
RESULTSThe average waiting time of a patient at the ED as perceived by majority of
health workers was 30minutes before being seen by a physician.
Health personnel thought that there was not much variation in the days when the ED is overcrowded but agreed afternoon shifts were mostly crowded among all shifts. Slide27
Source: Field Data, 2015Slide28
RESULTSHealth personnel most agreed strongly that inappropriate referrals 59.63% and
delays in getting radiological imaging 49.07%
were the main causes of overcrowding.Slide29
Table 4.1.3
CAUSES OF OVERCROWDING
VARIABLE
STRONGLY AGREE
AGREE
INDIFFERENT
DISAGREE
STRONGLY DISAGREE
FREQ
%
FREQ
%
FREQ
%
FREQ
%
FREQ
%
Lack of Hospital beds (106)
30
28.30%
34
32.08%
10
9.43%
16
15.09%
16
15.09%
Inappropriate Referrals (109)
65
59.63%
29
26.61%
5
4.59%
8
7.34%
2
1.83%
Patients who come without referrals (105)
40
38.10%
2523.81%1918.10%1615.24%54.76%Inadequate Personnel/staff(107)3229.91%3128.97%1413.08%2119.63%98.41%Inadequate logistics and tools (108)4440.74%
4339.81%
7
6.48%
12
11.11%
2
1.85%
Radiology Delays (108)
53
49.07%
44
40.74%
65.56%54.63%00.00%Laboratory Delays (106)3734.91%4441.51%109.43%1413.21%10.94%Delays in dispensing drugs (108)1715.74%4137.96%2220.37%2725.00%2725.00%Theatre Delays (107)4037.38%4441.12%1413.08%98.41%00.00%Delays in transporting patients (108)3229.91%3128.97%1413.08%2119.63%98.41%Delays in billing or assessments (108)3027.78%4238.89%1614.81%1917.59%10.93%
Source: Field Data, 2015Slide30
NEGATIVE EFFECTS OF OVERCROWDING ON PATIENT CARE
Table 4.1.4
NEGATIVE EFFECTS
OF OVERCROWNDING ON PATIENT CARE
VARIABLE (N=108)
STRONGLY AGREE
AGREE
INDIFFERENT
DISAGREE
STRONGLY DISAGREE
FREQ
%
FREQ
%
FREQ
%
FREQ
%
FREQ
%
INCREASED DELAY IN CLINICAL ASSESSMENT
52
48.15%
44
40.74%
7
6.48%
5
4.63%
0
0.00%
INCREASED MARGIN OF MEDCAL ERROR
35
32.41%
51
47.22%
9
8.33%
13
12.04%
0
0.00%
INCREASED STAFF STRESS
7771.30%2926.85%21.85%00.00%00.00%POOR WORK SATISFACTION6257.41%3734.26%76.48%21.85%00.00%Source: Field Data, 2015Slide31Slide32
Majority of the health workers (95%), said that overcrowding in the ED contributed to poor patient outcome.Ways in which health workers think overcrowding contribute to poor patient outcome include:
staff exhaustion (40.37%),
compromised quality of patient care (36.70%),
standard procedures not followed
(36.70%),
long waiting time of patients before being assessed by a physician
(29.36%) and
poor working conditions
(27.52%).Slide33
VARIABLE
FREQUENCY
PERCENTAGE
Long Waiting Time
32
29.36%
Logistics Not Enough
17
15.60%
Poor Health Worker Concentration
30
27.52%
Staff Exhaustion
44
40.37%
Can’t Explain
17
15.60%
Cross Infections
28
25.69%
Preventable Poor Outcome
28
25.69%
Standard Procedure Not Followed
40
36.70%
Quality of Care Compromised
40
36.70%
Don’t know
3
2.75%
EFFECTS OF OVERCROWDING ON POOR PATIENT OUTCOME
Source: Field Data, 2015Slide34
RESULTSHealth personnel strongly agreed that
Equipping district hospitals to handle non-emergency cases (77.78%),
Appropriate referral system (75.93%),
Provision of adequate logistics and consumables (57.41%) can help curb the problem of overcrowding.Slide35
Table 4.1.5
STRATEGIES
TO REDUCE PATIENT OVERCROWDING
VARIALE (N=)
STRONGLY AGREE
AGREE
INDIFFERENT
DISAGREE
STRONGLY DISAGREE
FREQ.
%
FREQ.
%
FREQ.
%
FREQ.
%
FREQ.
%
INCREASE NUMBER OF PERSONNEL (106)
28
26.42%
45
42.45%
13
12.26%
14
13.21%
6
5.66%
INCREASE NUMER OF BEDS (106)
31
29.25%
20
18.87%
13
12.26%
31
29.25%
11
10.38%
INCREASE THEATRE SPACE (108)
3229.63%4238.89%1715.74%1412.96%32.78%BUILD MORE EMERGENCY CENTRES (108)6459.263128.70%76.48%43.70%21.85%EQUIP DITRICT HOSPITALS TO HANDLE NON EMERGENCY CASES (108)8477.78%
2323.00%
0
0.00%
0
0.00%
1
0.93%
APPROPRIATE REFERRAL SYSTEM (108)
82
75.93%
25
23.15%
00.00%10.93%00.00%BED MANAGER POSITION (107)4844.86%3936.45%1514.02%54.67%00.00%PROVISION OF ADEQUATE LOGISTICS AND CONSUMABLES (108)6257.41%3835.19%43.70%43.70%00.00%Source: Field Data, 2015Slide36
RESULTSA greater number of the respondents (98%) agreed that information about bed state on the wards should be sent to the ED as a means of
curbing
overcrowding whiles 2% thought it was not a good idea.
Those who agreed, majority responded that ward bed states should be sent every
six hours (four times) in a day.Slide37
VARIABLE (N)
FREQUENCY
PERCENTAGE
PHONE CALL (48)
47
31.97%
TEXT MESSAGE (34)
34
18.18%
PHYSICALY GOING UP TO CHECK (34)
33
17.64%
MOBILE APP/ SOFTWARE (63)
63
33.68%
ALL OPTIONS ABOVE (10)
10
5.34%
Best ways identified to send ward bed state information to the
ward
Source: Field Data, 2015Slide38
RECOMMENDATIONSInternal Emergency Department Actions and Processes That Will Improve Access and Flow:
Limit
triage to what is crucial and bypass
triage altogether when
beds are
available.Develop a fast track for treating simple fractures, lacerations, sore throats, etc.
Expand
the practice of observation medicine.
Implement
triage protocols
.Slide39
Expand the size of the ED
Carefully
evaluate
staffing needs
Establish
clearly defined turnaround-time(TAT) goals in the emergency department.
Decrease
TAT associated with ancillary
services
Provide
additional staff during times of increased volume. Slide40
Match resources to needsCreate institutional awareness of the
dangers associated
with emergency
department crowding due to boarding of emergency patients.
Address delays
in moving emergency patients admitted to the hospital caused by waiting for nursing reports.Examine the discharge process and measure all reasons for delays in discharge of the patient.Establish hospital-wide protocols for addressing capacity issues in the emergency department and implement an alert system when the hospital is over capacity.
ACEP
2007
Hospital Actions and Processes That Will
Improve Access and FlowSlide41
CONCLUSIONOvercrowding in the ED is perceived to cause staff burn-out and result in poor patient outcomes. Evidence-based interventions may improve
overcrowding. Slide42Slide43
Cowan, R.M. & Trzeciak, S., 2005. Clinical review: Emergency department overcrowding and the potential impact on the critically ill. Critical care (London, England), 9(3), pp.291–5. Available at: http://www.ncbi.nlm.nih.gov/pubmed/15987383 [Accessed August 10, 2016].
Canadian Association of Emergency Physicians and National Emergency Nurses Affiliation, 2001.
Joint Position Statement on emergency department overcrowding. CJEM [Internet]. 2001 Apr 21 [cited 2016 Aug 12];3(2):82–4. Available from:
http://www.journals.cambridge.org/abstract_S1481803500005285
Forson
PK (2011). An audit of emergency care at the Accident and Emergency Unit of KATH, Kumasi, Ghana. Masters Thesis Community Health Department, KNUST, Kumasi. (Unpublished)
REFERENCESSlide44
Mchugh, M. & Dyke, K.V., 2011. and Reducing Emergency Department Crowding : A Guide for Hospitals Improving Patient Flow Department Crowding : improving Patient Flow and Reducing Emergency Department Crowding, p.8.
Boarding
Task Force Members et al., 2008. ACEP Task Force
Report
on Boarding Emergency Department Crowding: High-Impact Solutions, Available at: https://www.acep.org/content.aspx?id=32050 [Accessed September 6, 2016].
Ntow Marie, 2014. College of health sciences in partial fulfillment
of the requirements for the award of MPH degree in health services planning and management. Unpublished
REFERENCESSlide45