PPT-Precipitation Interception
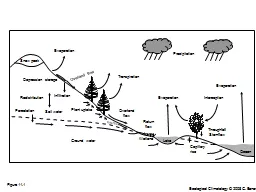
Throughfall Stemflow Evaporation Transpiration Evaporation Ocean Lake Ground water Overland flow Return flow Infiltration Redistribution Evaporation Snow pack Percolation
Download Presentation
"Precipitation Interception" is the property of its rightful owner. Permission is granted to download and print materials on this website for personal, non-commercial use only, provided you retain all copyright notices. By downloading content from our website, you accept the terms of this agreement.
Presentation Transcript
Transcript not available.