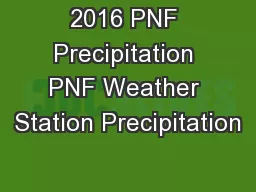
PPT-Annual Precipitation and Bird Population
Author : calandra-battersby | Published Date : 2017-10-07
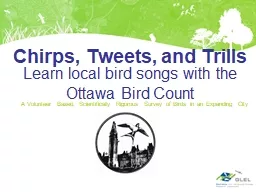
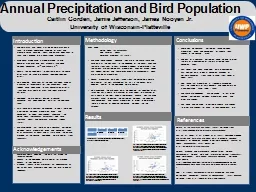
Caitlin Gorden Jamie Jefferson James Nooyen Jr University of WisconsinPlatteville The Christmas Bird Count started on Christmas day in 1900 to prevent widespread
Presentation Embed Code
Download Presentation
Download Presentation The PPT/PDF document "Annual Precipitation and Bird Population" is the property of its rightful owner. Permission is granted to download and print the materials on this website for personal, non-commercial use only, and to display it on your personal computer provided you do not modify the materials and that you retain all copyright notices contained in the materials. By downloading content from our website, you accept the terms of this agreement.
Annual Precipitation and Bird Population: Transcript
Download Rules Of Document
"Annual Precipitation and Bird Population"The content belongs to its owner. You may download and print it for personal use, without modification, and keep all copyright notices. By downloading, you agree to these terms.
Related Documents