/
Question   Explanation Question   Explanation

Question Explanation - PowerPoint Presentation

mitsue-stanley
mitsue-stanley . @mitsue-stanley
Follow
407 views
Uploaded On 2018-03-21

Question Explanation - PPT Presentation

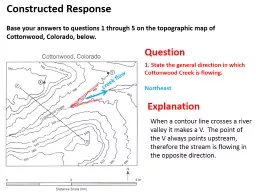
When a contour line crosses a river valley it makes a V The point of the V always points upstream therefore the stream is flowing in the opposite direction Constructed Response Base your answers to questions 1 through 5 on the topographic map of Cottonwood Colorado below ID: 659395

explanation map answers questions map explanation questions answers constructed pesticide responsebase elevation line points contour landscape question field gradient locations meters represents

Share:

Link:

Embed:

Download Presentation from below link

Download Presentation The PPT/PDF document "Question Explanation" is the property of its rightful owner. Permission is granted to download and print the materials on this web site for personal, non-commercial use only, and to display it on your personal computer provided you do not modify the materials and that you retain all copyright notices contained in the materials. By downloading content from our website, you accept the terms of this agreement.


Presentation Transcript

Slide1

Question

Explanation

When a contour line crosses a river valley it makes a V. The point of the V always points upstream, therefore the stream is flowing in the opposite direction.

Constructed ResponseBase your answers to questions 1 through 5 on the topographic map of Cottonwood, Colorado, below.

1. State the general direction in which Cottonwood Creek is flowing. Northeast

creek flowSlide2

Question

Explanation

Point B is within the contour line labeled 580 meters which means it has an elevation greater than 580 meters. Only points on the contour line

are at an elevation of 580 meters. Because the contour interval is 20 m, the next drawn contour line would be 600 meters. Because no such line was drawn point B can anywhere between 581-599 meters. The highest elevation in this range is 599 meters. Constructed Response

Base your answers to questions 1 through 5 on the topographic map of Cottonwood, Colorado, below. 3. State the highest possible elevation, to the

nearest meter, for point B on the topographic map. 599 meters

Slide3

Question

Explanation

Click on the following link to watch a video which describes how to draw a profile. https://www.youtube.com/watch?v=dA1J9kpi1nM

Constructed ResponseBase your answers to questions 1 through 5 on the topographic map of Cottonwood, Colorado, below.

4. On the grid below, draw a profile of the topography along line AB shown on the map.

creek valley must dip a little lower than 500 m line. Slide4

Question

Explanation

Refer to question 22 for full explanation.

Constructed ResponseBase your answers to questions 1 through 5 on the topographic map of Cottonwood, Colorado, below.

5. Calculate the gradient of the slope between the points X and Y on the topographic map, following the directions below. Write the equation for gradient.

Substitute data from the map into the equation.

Calculate the gradient and label it with the proper units.

Gradient

=


Gradient =


Gradient = 50

 Slide5

Question6. What is the latitude and longitude of Point A?

Explanation

Latitude (highlighted in green) run east to west and longitude (highlighted in purple) run north to south. Always list latitude first and always include directions (N,S, E,W).

Constructed ResponseBase your answers to questions 6 through 9 on the latitude-longitude system shown on the map. The map represents a part of the Earth’s surface and its coordinates (grid) system. Points A through F represent locations in this area.

50

o

N 70o WSlide6

Question7. What is the compass direction from point D toward point E?

Explanation

This is a pretty straight forward question. Be sure you know your cardinal directions.

Constructed ResponseBase your answers to questions 6 through 9 on the latitude-longitude system shown on the map. The map represents a part of the Earth’s surface and its coordinates (grid) system. Points A through F represent locations in this area.

northeastSlide7

Question8. In a sentence or two, explain where the map is located in relation to the Equator and Prime Meridian.

Explanation

Because the latitude lines on this map range from 20o N – 70o N, the map must located north of the Equator. Also, because the longitude lines on this map range from 40

o W – 90o W, the map must located west of the Prime Meridian.

Constructed ResponseBase your answers to questions 6 through 9 on the latitude-longitude system shown on the map. The map represents a part of the Earth’s surface and its coordinates (grid) system. Points A through F represent locations in this area.

North of Equator & West of Prime Meridian. Slide8

Question9. As a person travels from location E to location C, what will happen to the observed altitude of Polaris?

Explanation

In the Northern Hemisphere, your latitude is equal to the observed altitude of Polaris. Because the latitude is decreasing as you move from E to C so must the altitude. Refer to question 6 for full explanation.

Constructed ResponseBase your answers to questions 6 through 9 on the latitude-longitude system shown on the map. The map represents a part of the Earth’s surface and its coordinates (grid) system. Points A through F represent locations in this area.

The observed altitude of Polaris will decrease. Slide9

Question

Draw an accurate isoline map, following the directions below.

Use an interval of 50 ppb.

Begin your drawing with the 200-ppb line.

Explanation

An isoline is a line that connects points of equal value. Use the data points on the map to determine where the lines are drawn.

Constructed ResponseBase your answers to questions 10 through 12 on the information and the field map below.

A water-soluble pesticide was applied to the ground surface at location A as shown on the map. Precipitation occurred and some of the pesticide that was carried into the ground dissolved in the water. As the ground water moved through the ground it distributed the pesticide. A scientist took samples of the groundwater and determined the concentration of the pesticide in parts per billion (ppb). The field map shows the concentrations of pesticide. Slide10

Question

Explanation

As the distance from location A increases, the pesticide concentration decreases.

Constructed ResponseBase your answers to questions 10 through 12 on the information and the field map below.

A water-soluble pesticide was applied to the ground surface at location A as shown on the map. Precipitation occurred and some of the pesticide that was carried into the ground dissolved in the water. As the ground water moved through the ground it distributed the pesticide. A scientist took samples of the groundwater and determined the concentration of the pesticide in parts per billion (ppb). The field map shows the concentrations of pesticide.

11. Using one or more complete sentences, briefly describe the general pattern of pesticide concentrations as the distance from location A increases.

Location A has a pesticide concentration of 210 ppb, which is one of the highest concentrations. In general, all of the values decrease as you move outward from location A. Slide11

Question

Explanation

Constructed ResponseBase your answers to questions 10 through 12 on the information and the field map below.

A water-soluble pesticide was applied to the ground surface at location A as shown on the map. Precipitation occurred and some of the pesticide that was carried into the ground dissolved in the water. As the ground water moved through the ground it distributed the pesticide. A scientist took samples of the groundwater and determined the concentration of the pesticide in parts per billion (ppb). The field map shows the concentrations of pesticide.

Refer to question 22 for full explanation.

12. Use the isoline map you have made to determine the gradient of pesticide concentrations in ppb between points B and point C, following the directions below.

Write the equation for gradient.

Substitute data into formula.

Calculate the gradient and label it with the proper units.

g

=


g

=


g

= 25

 Slide12

Question13. The steepest slopes in this landscape are located along a straight line between which two letters?Line AD.

Explanation

Constructed Response

Base your answers to questions 13 through 16 on the diagram below which represents elevation data for a certain landscape region. Points A, B, C, and D are specific locations on the surface of this landscape.

Along line AD the contour lines are the closest therefore making part of the landscape the steepest. The easiest way to determine this is to draw contour lines in, which is what was done here.

Slide13

Question14. There is a lake in the landscape region. Place the letter “L” on the map where the lake would most likely be located and explain why you chose that location.

Explanation

Constructed ResponseBase your answers to questions 13 through 16 on the diagram below which represents elevation data for a certain landscape region. Points A, B, C, and D are specific locations on the surface of this landscape.

Due to the influence of gravity, water is constantly being pulled down. As a result, water pools in the lowest possible elevation.

This location is the lowest elevation and what collects in low lying areas.

LSlide14

Question15. A radio tower is located on the top of the highest hill on this map. Place the letter “R” where this tower is likely located.

Explanation

Constructed ResponseBase your answers to questions 13 through 16 on the diagram below which represents elevation data for a certain landscape region. Points A, B, C, and D are specific locations on the surface of this landscape.

The 300 meter contour line, which is the highest labeled elevation on this map, has been drawn. The elevation inside this line is possibly higher.

RSlide15

Question16. A person hiking from the radio tower to the lake would walk in what compass direction.

Explanation

Constructed ResponseBase your answers to questions 13 through 16 on the diagram below which represents elevation data for a certain landscape region. Points A, B, C, and D are specific locations on the surface of this landscape.

The map indicates where north is so all you need to do is determine the direction from the radio tower to the lake.

R

northwest

LSlide16

Question17. What is the contour interval of the map?

Explanation

If you count the number of contour lines between the labeled contour lines you can see that each line represents a change in 10 meters.

Constructed ResponseBase your answers to questions 17 through 20 on the topographic map below which represents a coastal landscape. The contour lines show the elevation in meters.

10 metersSlide17

Question18. What is the distance along the dirt road from point G to H?

Explanation

Use a piece of string and lay it over the road. Mark the distance of the road and then straighten the string, bring it down to the scale and determine the distance.

Constructed ResponseBase your answers to questions 17 through 20 on the topographic map below which represents a coastal landscape. The contour lines show the elevation in meters.

3.0 – 3.5 kmSlide18

Question

19.

In what compass direction does the river flow between points E and F? Explain one way can determine the direction of flow.

Explanation

All water flows downhill and the oceans are the lowest elevations on Earth.

Constructed ResponseBase your answers to questions 17 through 20 on the topographic map below which represents a coastal landscape. The contour lines show the elevation in meters. South – The river is connected to the ocean, which is the lowest elevation. Slide19

Question

Show your work and label with appropriate units.

Write the equation used to determine gradient.

Determine the gradient from point C to point D.

Explanation

Refer to multiple choice question 22 for complete explanation.

Constructed ResponseBase your answers to questions 17 through 20 on the topographic map below which represents a coastal landscape. The contour lines show the elevation in meters.

g

=


g

=


g

=


g

= 15

 Slide20

Question21. On the temperature field map, draw three isotherms: the 23o C isotherm, the 24

o C isotherm, and the 25 o C isotherm.

Explanation

An isotherm is a line that connects points of equal temperature. If your isoline doesn’t connect to make a circle, it must extent to the edges of the map.

Also, be sure that when you draw an isotherm you take into consideration of the other temperature values. Constructed ResponseBase your answers to questions 21 through 22 on the temperature field map below. The map shows 25 measurements (in

oC) that were made in a temperature field and recorded as shown. The dots represent the exact locations of the measurements. A and B are locations within the field. Slide21

Question22. In the space provided, calculate the temperature gradient between locations A and B on the temperature field map, following the directions below.

Constructed ResponseBase your answers to questions 21 through 22 on the temperature field map below. The map shows 25 measurements (in oC) that were made in a temperature field and recorded as shown. The dots represent the exact locations of the measurements. A and B are locations within the field.

Write the equation for gradient.

Substitute data from the map into the equation.

Calculate the gradient and label it with the proper units.

g

=


g

=


g

=