PPT-Serfs and Slaves Venn Diagram
Author : mitsue-stanley | Published Date : 2017-06-14
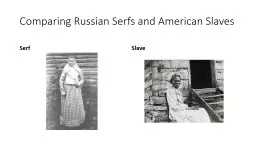
Mrs Tucker 7 th Grade World HistoryHonors Cobalt Institute of Math and Science Serfs and Slaves Venn Diagram Serfs Could not be sold Protected by Lord Given land
Presentation Embed Code
Download Presentation
Download Presentation The PPT/PDF document "Serfs and Slaves Venn Diagram" is the property of its rightful owner. Permission is granted to download and print the materials on this website for personal, non-commercial use only, and to display it on your personal computer provided you do not modify the materials and that you retain all copyright notices contained in the materials. By downloading content from our website, you accept the terms of this agreement.
Serfs and Slaves Venn Diagram: Transcript
Download Rules Of Document
"Serfs and Slaves Venn Diagram"The content belongs to its owner. You may download and print it for personal use, without modification, and keep all copyright notices. By downloading, you agree to these terms.
Related Documents