/
Usefulness of semi-automatic tools forairborne minefield detectionP. D Usefulness of semi-automatic tools forairborne minefield detectionP. D

Usefulness of semi-automatic tools forairborne minefield detectionP. D - PDF document

mitsue-stanley
mitsue-stanley . @mitsue-stanley
Follow
421 views
Uploaded On 2015-09-06

Usefulness of semi-automatic tools forairborne minefield detectionP. D - PPT Presentation

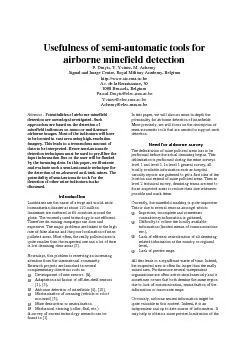
polluted areas As a byproduct such data allows toupdate the existing old and inaccurate mapsIt is unlikely that airborne survey might replace onfield detection in the near future Indeed even if ID: 122677

polluted areas. by-product

Share:

Link:

Embed:

Download Presentation from below link

Download Pdf The PPT/PDF document "Usefulness of semi-automatic tools forai..." is the property of its rightful owner. Permission is granted to download and print the materials on this web site for personal, non-commercial use only, and to display it on your personal computer provided you do not modify the materials and that you retain all copyright notices contained in the materials. By downloading content from our website, you accept the terms of this agreement.


Presentation Transcript

Usefulness of semi-automatic tools forairborne minefield detectionP. Druyts, Y. Yvinec, M. Acheroy Signal and Image Centre, Royal Military Academy, Belgiumhttp://www.sic.rma.ac.beAv. de la Renaissance, 301000 Brussels, Belgium Pascal.Druyts@elec.rma.ac.beYvinec@elec.rma.ac.beAcheroy@elec.rma.ac.beAbstract - Potentialities of airborne minefielddetection are nowadays investigated. Suchapproaches are based on the detection ofminefield indicators on mono or multi-sensorairborne images. Most of the indicators will haveto be located in vast area using high-resolutionimagery. This leads to a tremendous amount ofdata to be interpreted. Hence semi-automaticdetection techniques must be used to pre-filter theinput information flux or the user will be floodedby the incoming data. In this paper, we illustrateand evaluate such a semi-automatic technique forthe detection of un-obscured anti-tank mines. Thepotentiality of semi-automatic tools for thedetection of other mine indicators is alsodiscussed.IntroductionLandmines are the cause of a huge and world-widehumanitarian disaster as about 110 millionlandmines are scattered in 64 countries around theglobe. The currently used technology is not efficient.Therefore de-mining campaigns are slow andexpensive. The major problems are linked to the highrate of false alarms and the poor localisation of minepolluted areas. Most often, the really polluted area isquite smaller than the suspected one and a lot of timeis lost demining clear areas [2].Nowadays, this problem is receiving an increasingattention from the international community.Research projects are launched in severalcomplementary directions such as: Development of new sensors [8], Adaptation and fusion of off-the-shelf sensors[1], [3], Airborne detection of minefields [4], [10], Mechanisation of scanning (vehicle or robotmounted) [5], Mine destruction or neutralisation, Mechanical clearing (roller, flail, etc.).A survey of current technology research can befound in [1].In this paper, we will discuss more in-depth thepotentiality for airborne detection of minefields.More precisely, we will focus on the description ofsemi-automatic tools that are needed to support suchdetection.Need for airborne surveyThe delimitation of mine polluted areas has to beperformed before the actual demining begins. Thisdelimitation is performed during the mine surveyslevel 1 and level 2. In level 1 general survey, alllocally available information such as hospitalcasualty reports are gathered to get a first idea of thelocation and extend of mine polluted areas. Then inlevel 2 technical survey, demining teams are sent tothose suspected areas to reduce their size wheneverpossible and mark them.Currently, the minefield marking is quite imprecise.This is due to several reasons amongst which: Imprecise, incomplete and sometimescontradictory information is gathered, Difficulty to collect the locally availableinformation (limited means of communicationsetc.), Lack of efficient centralisation of all deminingrelated information at the country or regionallevel, Lack of precise maps.All this leads to a significant waste of time. Indeed,the suspected area is often far larger than the reallymined area. Furthermore several independentorganisations are often active simultaneously and itsometimes occurs that both demine the same regiondue to lack of communication, centralisation of theinformation or inaccurate maps.Obviously, airborne sensed information might bequite valuable in this context. Indeed, it is anindependent and up to date source of information. Itmay help to obtain a more precise localisation of the polluted areas. As a by-product, such data allows toupdate the existing old and inaccurate maps.It is unlikely that airborne survey might replace on-field detection in the near future. Indeed, even ifsome mines may be detected using airborne sensors,the probability of detection will most probably be fartoo small. However, airborne survey may be quiteeffective for minefield detection because it is notnecessary to find all the mines and furthermore,other indirect minefield indicators may be used.Need for semi-automatic detection toolsTo demonstrate that airborne survey may efficientlybe used for humanitarian demining support, oneshould show that: Reliable mine indicators may be found in theused imagery Those indicators may be found in a reasonabletimeframe using reasonable resources.Nowadays, experienced human photo-interpretersclearly outperform any automatic system when oneconsiders the interpretation of a reasonable amountof data especially when completeness of the analysisor the handling of exceptional cases is considered.Indeed, human operators can adapt very easily to anew situation or make the best use of any collateralinformation.However, the evolution in the imaging technologiesleads to an increase of the resolution and the numberof available spectral bands. All this leads to anexponential increase of the amount of available dataon one hand but on the other hand, the number oftrained image analysts remains fairly stable and willcertainly not grow exponentially for economicreasons. Furthermore, human beings dislike routinework.Imagine that mines may be found on 1cm-resolutionimages and that an area of 10 km by 10 km has to bescanned. An operator would typically spend1 minute on each 1,000 x 1,000 sub-image. The totalneeded time may then be estimated to 695 days or 10man-years.In practice, the needed time may be reduced by ahierarchical approach in which some regions mayfirst be rejected on a coarser image using othercriteria. However, the above figures clearly showthat human interpreters may expect to be flooded bythe amount of information to treat if they are notsupported by efficient semi-automatic tools.Therefore, the most promising approach forproblems where the new high-resolution imagingcapabilities have to be used is a semi-automaticsystem in which the machine pre-filters the incomingflux of information presenting regions of interest tothe user. We argue that this approach leads to thebest synergy between the analyst and the machine bycombining the huge computation power of moderncomputers with the outstanding interpretationcapabilities of human beings.Commercial software packages, combining aerialimage manipulation with the management of vector-style geographical information, do not include suchtools. What these software packages excel in,however, is low-level image processing performedby their huge libraries: filtering the image in order toobtain a smoother noise-filtered image, making theimage sharper, eliminating some unwanted blurringeffect, detecting edges and so one. Although weagree that tools dedicated to pure image processingmay be quite useful, we believe that more‘intelligent’ semi-automatic tools are also promising.ApplicationThe project ‘airborne minefield detection: pilotproject’ led by ITC is an example of an applicationwhere semi-automatic tools can be useful. The aim isto study the possibility of detecting minefields byairborne surveys. The project is divided in twophases.In phase I, the sensors and the algorithms were testedin a simulated minefield in Leopoldsburg (Belgium).This minefield is composed of several smallerminefields. For one of them, named ‘minefield C’,everything about the mines laid, including theiraccurate positions and depths, is known. The sensorsused were colour, colour infrared and thermalinfrared cameras and X- and Y-band radar. Theimages where mines could be found are high-resolution (around 1cm) colour and colour infraredimages. In what follows, only these two images willbe considered. Phase I is now completed.In phase II, the most promising sensors will be usedfor airborne surveys of a mine-polluted country inAfrica.Selected Mine indicatorsThe detectable indicators are function of the selectedsensors (spectral band, resolution, etc.). Direct andindirect minefield indicators ranging from the mineitself to an old military camp may be considered.In the first phase of the project, the semi-automaticdetection of un-obscured anti-tank mines wasconsidered. Obviously, minefields composed of suchmines we are amongst the easiest to detect and otherindicators have to be investigated. For complex mine indicators, it will probably be necessary to make useof a search strategy and to feed the system withexpert knowledge [9].The initial choice was motivated as follows: Ideal choice for a semi-automatic approach:simple model and high resolution needed. Promising mine indicators have to be defined bythe photo-interpreters. This was only donerecently for a test minefield simulated inLeopoldsburg (Belgium). Furthermore, semi-automatic tools do not have the humancapability to adapt to new situations. It istherefore crucial to develop detectors that aredevoted to promising indicators for the targetedregion. Hence the selection of the mineindicators was deferred to the end of this yearwhen images of real minefields are available.Building a mine (indicator) modelAny tool dedicated to the detection of mineindicators encodes (either explicitly or implicitly) amodel of the searched indicator. The used modelshould be selected with care. The expertise of photo-interpreters is very useful for this step especiallywhen complex indicators are considered. Due to itssimplicity, the model used here was developedwithout their help. Therefore, the available imageswere visually inspected to find mine characteristicfeatures. Most of the images were geo-referenced,and put together in a virtual image. The positions ofthe known mines were encoded together with theirattributes. All this allows for an easy navigationthrough regions of interest centred on the knownmines. For a recorded mine of interest the user mayrequest the available attributes (type, depth etc.) aswell as the available image channels. It is thenpossible to go from an available channel to anotheror to display all channels simultaneously in acommon projection.The used mine modelSome vegetation anomalies (e.g. missing vegetation)can be seen where mines are laid. Unfortunately, ahuge amount of such regions exists and to reach areasonable false alarm rate, complementary minecharacteristics (specific patterns [7], signature indifferent spectral bands, etc.) have to be introducedin the model. Therefore, in a first approach thetypical spectral response of an anti-tank mines lyingon the ground was used. A typical example of such amine may be found in Figure 1. The imagerepresents the blue band of a colour infrared image.The mine is the white area at the centre of the image(the blue component on colour infrared image isactually the response of the object in the green partof the spectrum).Figure 1 Mine used to tune the algorithmsAlgorithms for mine detectionThe algorithm is based on a maximum detectionfollowed by a region growing in the blue band. Thegrowing algorithm uses a rough model of the mine tocompute a local contrast used to derive the growingstop criteria.Figure 2: Result of growing around a mine onCIR image Figure 2 presents the results of the growingalgorithm. Figure 3 presents the blue band (on whichthe growing is performed) of the same area. As canbe seen on the window displayed by clicking themine location (see Figure 2), the type of the minewas encoded; it is an anti-tank mine lying on theground. The mine is well detected but some otherregions are also found. To reduce the false alarmrate, geometrical and radiometric attributes (using allavailable spectral bands) are computed for each minecandidate and a criterion based on those attributes isthen used. Figure 4 presents the attributes used andthe result after filtering. In the presented region allfalse alarms were rejected, keeping only the actualmine. Figure 5 presents the mine candidates foundusing the same approach on a part of the visibleimage.Figure 3: Blue band corresponding to Figure 2Figure 4: Attribute used and results after filteringFigure 5 Mine-like objects detected on visibleimageDetection of partially occluded circlesAs explained above, the shape of the candidateregions may be used as discriminant feature. Mineslying on the ground often present circular shapes.However, the mine is often partially occluded andwe developed an algorithm that is able to recognisecircular shapes even if they are partially occluded.This algorithm is based on robust estimationmethods [6]. A measure of the circularity is returnedtogether with an estimation of the radius. The radiusprovides a better estimation of the size of the objectthan the visible area (partial occlusion) and is thusmore discriminating.The algorithm estimates a circle that goes throughmost of the pixels of a given list. This is useful whenit is known that the pixels should lie along a part of acircle but some of them can be wrong and very farfrom the circle.Several triplets of pixels are selected in the list andthe circles defined by these three pixels arecomputed. For each circle, the distances of all the pixels of the lists to this circle and the percentiles ofthese distances are computed. The circle selected isthe one giving the smallest percentiles of errors. Thenumber of triplets is computed to have at least onetriplet without erroneous pixel, and thus a correctcircle with a probability of 99 % taking into accountthe expected rate of erroneous pixels.Figure 6 shows a close-up of an anti-tank mine incolour infrared. Only a part of the mine is visible.The blue colour is due to the fact that the colourgreen is seen blue in colour infrared.Figure 6 Initial imageFigure 7 shows the contour of the mine detected.Because of the occluded part, the shape is notcircular.Figure 7 Contour of the mineFigure 8 shows the circle estimated from theprevious contour. It is a good approximation of theposition and size of the mine. If an absolute co-ordinate system is available, it is possible to estimatethe real size of the mine, which is an indication forthe type of mine.Figure 8 Circle around the mineEvaluationThe following images present the result of theautomatic mine detection on the full visible andcolour infrared images. Note that the size of thevisible image is about 400 MB and this image coversa region of about 500 square metres. The full imagewas processed in about 30 minutes on a Pentium Pro(200 MHz, 64 MB RAM) running under Linux. InFigure 9 and Figure 10, the position of known mineshas been superimposed on both images (dots areknown mines and crosses are mines proposed by thealgorithm).On the visible image, a V-shaped minefield has beendetected. Note that no mine of minefield C has beenfound. The anti-tank Mine 281 (lying on the groundand well visible) was first detected but rejected bythe attribute based filter. Using a better filtercriterion, it could be possible to keep that minewithout increasing the false alarm rate but littleeffort was spent for this fine-tuning because webelieve that an algorithm that learns from exampleshould be used in practice. This could not be testeduntil now because the database contains too fewexamples of known and detected mines. In thiscontext a learning scheme would probably lead topoor results (over-training).On the colour infrared image that presentsminefield C at a higher resolution but with only asmall neighbouring region (the V-shaped minefieldis not in the imaged region), three anti-tank mines,on and below the surface of minefield C, have beendetected. Note that for the buried anti-tank mines, itis a stick lying near the mine that is detected. Evenif the stick may be considered as a valid mineindicator, it was found ‘by chance’ since the algorithm was not developed to find such objects.We concentrated our efforts on the detection ofindicators that could be helpful in real situations. Ifit appears that such sticks are good indicators, abetter detector will be developed.ConclusionA tool was developed to find anti-tank mine lying onthe ground. Most of those mines were detected andthe false alarm rate is reasonable. Even two buriedmines were found because sticks left in the vicinityof the mines were detected. We believe that the falsealarm rate could be reduced in the near future bysome simple improvements. As an example manyfalse alarms in the colour infrared are found in thetrees. A tree detection algorithm could reduce thefalse alarm rate significantly.The human interpreters outperformed the semi-automatic system by their ability to integrate in theirreasoning a great number of mine indicators: sevenminefields out of nine were successfully detectedwith three false alarms. The most used andpromising indicator was the alignment of soilperturbation.We admit that if image processing is only able todetect anti-tank lying on the ground, its usefulness inreal situations would be quite limited. However,photo-interpreters are able to detect more minefieldsusing other indicators. During phase II, the mostpromising indicators will be selected in collaborationwith the photo-interpreters. Semi-automatic toolswill then be developed to detect such indicators.Although limited, the results of the first evaluationpresented in this paper have shown that significantprocess acceleration can be reached by means ofimage processing. By removing the false alarmsfound in the trees of the colour infrared image, thealarms found could be grouped in about 10 regionsof interest. If the photo-interpreter takes 30 secondsto look at each region, 5 minutes would be needed toanalyse the scene. When carrying out a full visualinspection at full resolution, the photo-interpreterwould typically spend at least one minute for aregion of 1,000 by 1,000 pixels. 150 such regionshave to be analysed for a full coverage of the colourinfrared image leading to about 2 hours ofinterpretation. A process acceleration of about 60may thus be expected. Such a speed-up would bevery useful in an operational context where theamount of data to be analysed would be tremendous.Without image processing and with the sameassumptions as above, 650 man-hours would beneeded for a complete visual inspection of a scene of10 km by 10 km.AcknowledgementThis work has been performed in the scope of the‘airborne minefield detection: pilot project’ led byITC and co-funded by the European Commission.More information about this project can be found athttp://www.itc.nl/ags/projects/demining/.DOVO/SEDEE, the bomb disposal unit of theBelgian army, is in charge of the minefield inLeopoldsburg.Bibliography[1] C. Bruschini and B. Gros, ‘A Survey of CurrentSensor Technology Research for the Detection ofLandmines’, International Workshop on SustainableHumanitarian Demining (SusDem©97),29 September-1 October 1997, Zagreb, Croatia[2] J. A. Craib. ‘Mine detection and demining froman operator’s perspective’. Workshop of anti-personnel mine detection and removal, Lausanne,30th June and 1st July 1995[3] Fritzsche, Martin ‘Detection of buried land minesusing ground-penetrating radar’. Proc. SPIE Vol.2496, p. 100-109, Detection Technologies for Minesand Minelike Targets, Abinash C. Dubey; IvanCindrich; James M. Ralston; Kelly A. Rigano; Eds,June 1995[4] J.L. van Genderen and B.H.P. Maathuis,‘Airborne Detection of Landmines: a Review of theTechniques and some practical Results’, DGPsession, Disarmament and International Security,Regensburg Germany, 26th March 1998.[5] S. Havlík and P. Licko, ‘Humanitarian demining:the challenge for robotic research’, Journal ofHumanitarian demining, Issue 2.2, June 1998[6] P.J. Huber, ‘Robust Statistics’, John Wiley &Sons, New York 1981.[7] D. E. Lake, B. Sadler and S. Casey: ‘Detectingregularity in minefields using collinearity and amodified Euclidean algorithm’ Proc. SPIE Vol.3079, p. 500-507, Detection and RemediationTechnologies for Mines and Mine like Targets II,Abinash C. Dubey; Robert L. Barnard; Eds. July1997 [8] McFee, John E.; Ripley, Herb T. ‘Detection ofburied land mines using a CASI hyperspectralimager’. roc. SPIE Vol. 3079, p. 738-749, Detectionand Remediation Technologies for Mines andMinelike Targets II, Abinash C. Dubey; Robert L.Barnard; Eds. July 1997 [9] W. Mees, P. Druyts, D. Borghys, Y. Ouaghli, C.Miravet, J. Santamaria, H. Suess, C. Perneel, M.Acheroy, and J.-L. Valero. ‘Semi-automaticinterpretation of airports using multi-sensorinformation’. IEEE Transactions on Geoscience andRemote Sensing, submitted.[10] K. Scheerer: ‘Airborne multi-sensor system forthe autonomous detection of landmines’. Proc. SPIEVol. 3079, p. 478-486, Detection and RemediationTechnologies for Mines and Mine like Targets II,Abinash C. Dubey; Robert L. Barnard; Eds. July1997Figure 9: mines candidates (crosses) and actual mines (dots) on the visible image Figure 10: mines candidates (crosses) and actual mines (dots) on the colour infrared image