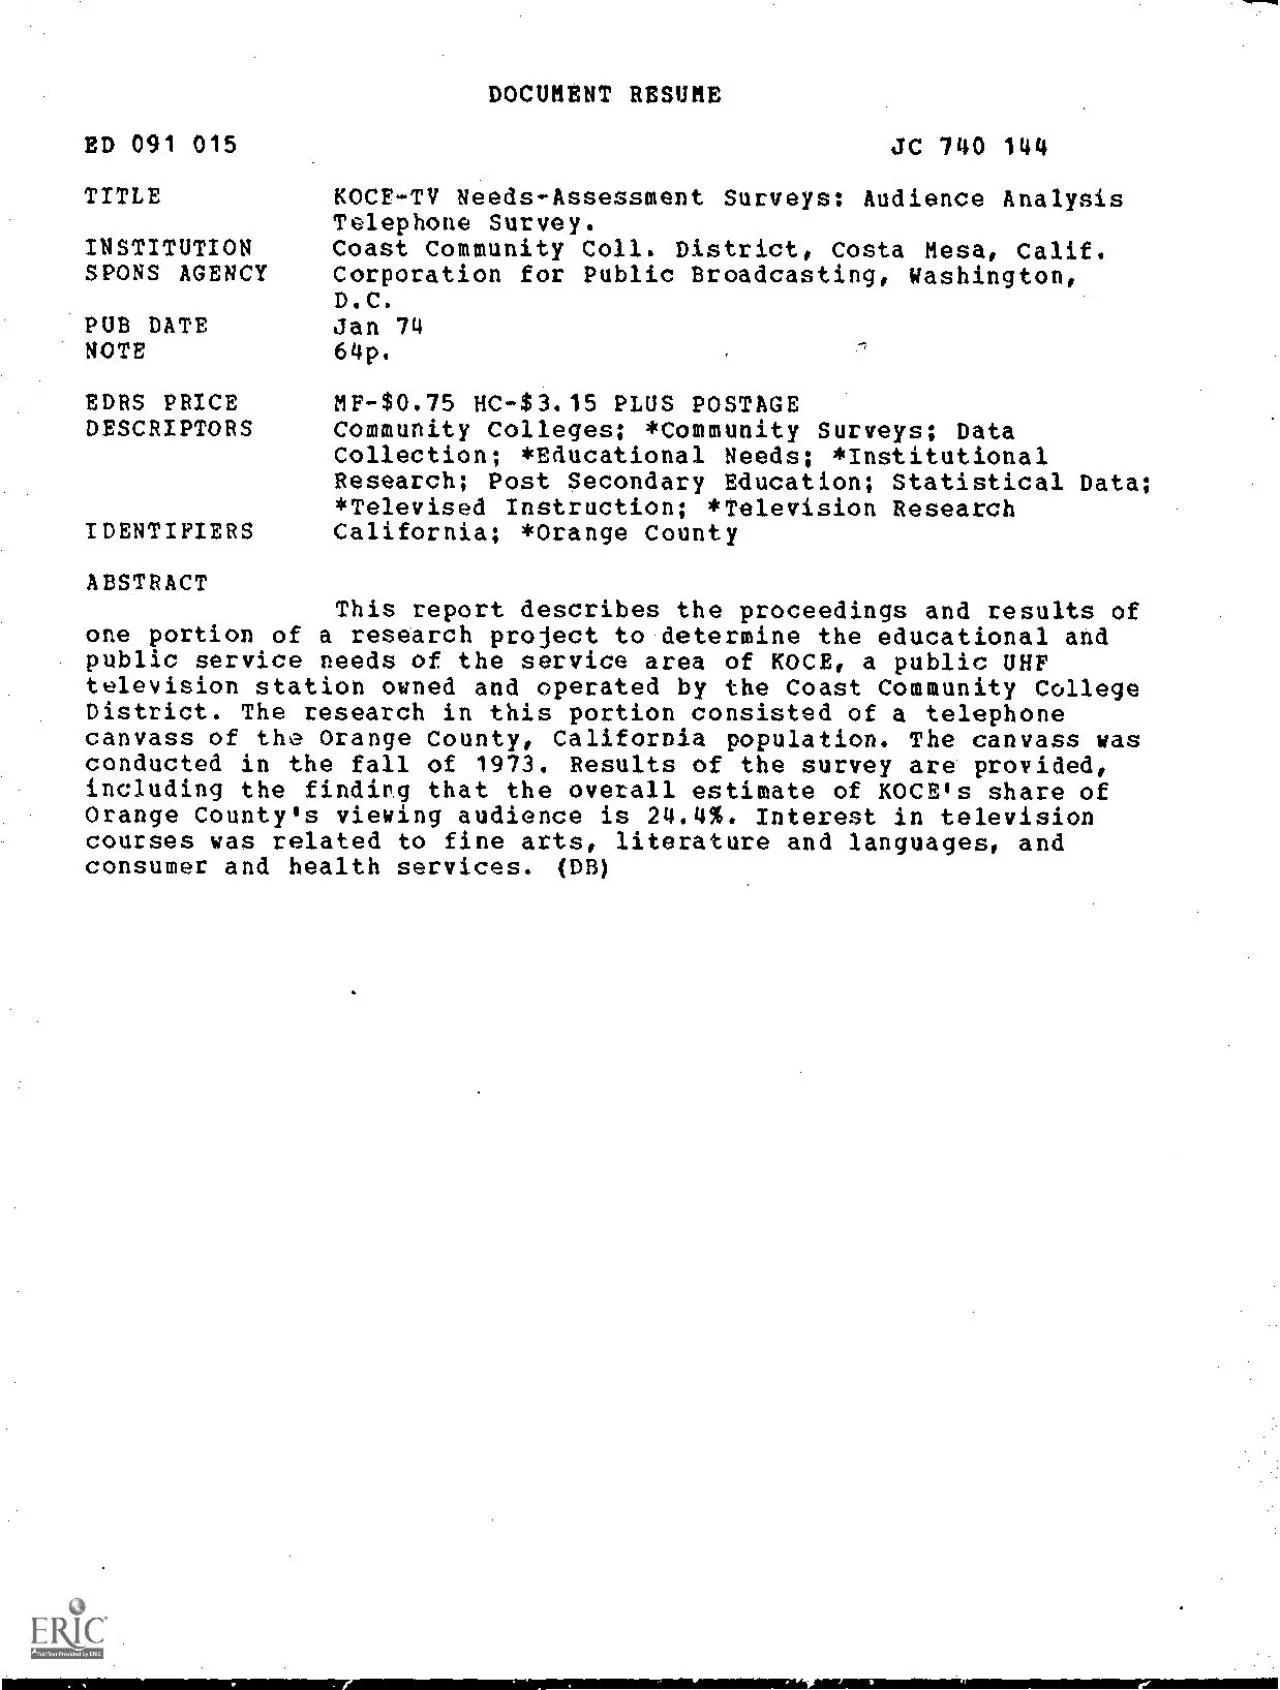
/
DOCUMENT RESUMEED 091 015JC 740 144TITLEKOCETV NeedsAssessment Surve DOCUMENT RESUMEED 091 015JC 740 144TITLEKOCETV NeedsAssessment Surve

DOCUMENT RESUMEED 091 015JC 740 144TITLEKOCETV NeedsAssessment Surve - PDF document

molly
molly . @molly
Follow
344 views
Uploaded On 2021-06-26

DOCUMENT RESUMEED 091 015JC 740 144TITLEKOCETV NeedsAssessment Surve - PPT Presentation

11UfDEPARTMENT OF HEALTHEMICATIONSWILCARENATIONAL thiStITUTE OFEDUCATION115 DOCUMENT reAS BEEN REPROOuCED EXACTLY AS RECEDED FROM1HE PERSON OR ORGANIZATION ORIGINATINO tt POINTS Or VIEW OR OPINIONS ID: 847137

television koce orange county koce television county orange table viewers courses telephone viewing public children percent kcet programs program

Share:

Link:

Embed:

Download Presentation from below link

Download Pdf The PPT/PDF document "DOCUMENT RESUMEED 091 015JC 740 144TITLE..." is the property of its rightful owner. Permission is granted to download and print the materials on this web site for personal, non-commercial use only, and to display it on your personal computer provided you do not modify the materials and that you retain all copyright notices contained in the materials. By downloading content from our website, you accept the terms of this agreement.


Presentation Transcript

1 DOCUMENT RESUMEED 091 015JC 740 144TITLE
DOCUMENT RESUMEED 091 015JC 740 144TITLEKOCE-TV Needs-Assessment Surveys: Audience AnalysisTelephone Survey.INSTITUTIONCoast Community Coll. District, Costa Mesa, Calif.SPONS AGENCYCorporation for Public Broadcasting, Washington,D.C.PUB DATEJan 74NOTE64p.EDRS PRICEMF-$0.75 HC-$3.15 PLUS POSTAGEDESCRIPTORSCommunity Colleges; *Community Surveys; DataCollection; *Educational Needs; *InstitutionalResearch; Post Secondary Education; Statistical Data;*Televised Instruction; *Television ResearchIDENTIFIERSCalifornia; *Orange CountyABSTRACTThis report describes the proceedings and results ofone portion of a research project to determine the educational andpublic service needs of the service area of KOCE, a public UHFtelevision station owned and operated by the Coast Community CollegeDistrict. The research in this portion consisted of a telephonecanvass of the Orange County, California population. The canvass wasconducted in the fall of 1973. Results of the survey are provided,including the f

2 inding that the overall estimate of KOCE
inding that the overall estimate of KOCE's share ofOrange County's viewing audience is 24.4%. Interest in televisioncourses was related to fine arts, literature and languages, andconsumer and health services.(DB) 11UfDEPARTMENT OF HEALTHEMICATIONSWILCARENATIONAL thiStITUTE OFEDUCATION'11,5 DOCUMENT reAS BEEN REPROOuCED EXACTLY AS RECEDED 'FROM1HE PERSON OR ORGANIZATION ORIGINATINO tt POINTS Or VIEW OR OPINIONSSTAYED 00 NOT NECESSARILY REP RESENT OFFICIAL NATIONAL 'NSW uTĀ£OFEDuCAliON ROS61,0N OR ROL,CYCoastCommunity Collegedistrict1370 ADAMS AVENUECOSTA MESACALIFORNIA 92626KOCE-a TVNEEDS -ASSIISSM1 SURVEYSAUDIENCE ANALYSIS TELEPHONE SURVEYOFFICE OF INSTITUTIONAL RESEARCHJANUARY, 1974ORANGE COAST COLLEGEGOLDEN WEST COLLEGEHUNTINGTON BEACHCOSTA MESA KOCE-TVNEEDS ASSESSMENT SURVEYSAUDIENCE ANALYSIS TELEPHONE SURVEYOffice of Institutional ResearchJanuary, 1974 PREFACEThis report describes the proceedings and results of oneportion of a research project funded by the Corporation forPublic B

3 roadcasting to determine the educational
roadcasting to determine the educational and publicservice needs of the service area of POCE, a public URF tele-vision station owned and operated by the Coast Community CollegeDistrict.The portion discussed in these pages consisted of atelephone canvass of the Orange County, California, populationconducted in the fall of 1973.The summary, found on pages ii and ill, provides theessence of the findings of the teieptwe survey.Referencesin it to table numbers and pages should lead the reader toadditional data if desired.We went to thank Douglas A. Fuchs, our consultant, forhis guidance in setting up the telephone procedures and hishelp in analyzing the data.For additional information about the project, write to theOffice of Institutional Research, Coast Community College Dis-trict, 1370 Adams Avenue, Costs Mess, California, 92626.Prole9t_StaffTeri L. RoffmanJean P. RiesCarol E. TerasRichard W. Brightman,Project Director Summary of FindingsA random sample of 2,873 telephone subscribers in

4 Orange County,California, was contacted
Orange County,California, was contacted in the fall of 1973 to ascertain the natureof the county's television viewing habits with respect to public tele-vision and needs for televised college courses.Comparing the samplegroup with available data from the 1970 census for Orange County foundit to be fairly representative in terms of location of residefice,occupation of head of hm.sehold, education of head of household, andnumber of children in the household (Tables I through IV).The followingsummarizes information obtained by conducting telephone interviews withthe respondent group.1.Orange County residents confuse the term "public television"with UHF television, believing in a frequent number.ofinstances that all UOF stations are publically supported.Less than 40 percent could correctly identify a public T.V.station serving the county (Table V).There are no impor-tant differences between the number of men and women whocan identify a public television station (Table VI).2.Over 10 perc

5 ent of the Orange County population was
ent of the Orange County population was ableto identify ROCS by call letters or by channel assignmentafter its first year of broadcasting (Table V).3.Most KOCE viewers are also viewers of KCET.Nearly thirtypercent of KCET viewers have also watched KOCE (Table VII).4.Over seventy percent of those who have watched at leastone program over KOCE reported that reception was as goodor better than other television stations they received(Table VIII).No important differences in quality ofreception is found between KOCE and Km' (Table X).5.The one beat overall estimate of KOCE's share of OrangeCounty's viewing audience is 24.4 percent (Page 18).6.The proportion of KOCE viewers in Orange County citiesshows that viewership is fairly evenly distributed through-out the county with the exception of those areas shelteredfrom KOCE's antenna by hills (Table XXII).7.The "typical" KOCE viewer is a professional or proprietorialperson having completed more than 12 years of formal educa-tion.He has childre

6 n in his household younger than 18years
n in his household younger than 18years of age, and owes more than one television set.Demographic differences, however, between the KOCE viewersand nonviewers cannot be used to clearly differentiate onefrom the other (Tables XIV through XVII).it 8..KCET is perceived more es a source of children'. progressthan is KOCE.Although Ossase Street appears as the mootfrequently cited program viewed for both stations, children'sprograms are identified more frequently by KCET viewers asbeing watched than is true for ROCS (Table XX through XXVII).9.Almost 31 percent of all respondents said that they knewabout television courses and that they found out about themfrom newspapers more than any other source of information(Table XXVII).10.More KOCE viewers than nonviewers are interested in takingtelevision courses.Moreover, the confirmed televisionenthusiast'is more likely to be interested in televisioncourses than is someone less attracted to the medium.Thoseinterested in taking television courses a

7 re more educated,work in sales/clerical
re more educated,work in sales/clerical occupations and subscribe to cableantenna service to a greater extent than those not interested(Tables XXVIII through XXXV/).11.Those interested in taking courses over television showgreatest interest in social sciences, fine arts, literatureand languages, and consumer and health services (Table XXXVII).12.More women than men are interested in taking college coursesover television (Page 38).iii TABUS OPcontrarm.PrefaceSmeary of FindingsiiList of TablesivInitial Audience Analysis Telephone Survey2Procedures2Respondent Group Characteristics4Orange County Public Television Viewing9Viewing Palle Television9Perceived Quality of U87 Reception14AimounC o/ Television Use16The KOCE :Audience18ROCS Viewers18Geographit Distribution18ROCS Viewer Profile21Programs Recalled by KOCE Viewers25.Televisiou Courses31Awareness of Television Courses31Interest in Enrolling in Telecourse,32Conclusions41 TableIIIIIIIVVVIVIIVIIIIXXXIXIIXIIIXIVXVXVIXVIIxvIIIXIXxxXXIxxtt

8 xxittXXIVXXVXXVIxxvItXXVIIIxxixXXXxxxtxx
xxittXXIVXXVXXVIxxvItXXVIIIxxixXXXxxxtxxxitxxxtttXXXIVxxxvxxxvtXXXVIIXXXVIIIXXXIXLIST OF TAMSPaeDistribution of Orange County Population and SurveyRespondents5Occupation of Head of Household:Respondents vsOrange County6Education of Head of Household:Respondents vs OrangeCounty Population7Number of Children in Household Less Than 18 Years ofAge:Respondents vs Orange County7Respondents Identifying A Public Television Station10Ability To Identify A Public TV Station:Male vs Female11Respondents Viewing KOCE and KCET12KOCE Viewers Perception of Quality of UHF Reception15Cable Television Service Subscribers15PTV Reception Quality In Orange County16Hours of Television Set Operation17Weekly Viewing of KOCE by Heavy Viewers17City Distribution of Respondents and Viewers20Occupation of the Head of the Household22Education of the Head of the Household22Children in the Household23Number of Television Sets in the Household23Reception Quality:VHF vs UHF24Sources of Orange County News24Most Frequent

9 ly Viewed Programs on KOCE25KOCE Viewing
ly Viewed Programs on KOCE25KOCE Viewing Categories by Frequency of Mention26host Frequently Viewed Prograns on KCET28KCET Viewing Categories by Frequency of Mention28Total KOCE Viewing Categories, Questions 2 and 429Orange County Public Television Viewing Categories29KCET and KOCE Viewed Programs30Respondent Knowledge of Telecou:sesInterest in Television Courses:KOCE Viewers vsNonviewersInterest in Television Courses:Amount of Daily TVOperationInterest in TelevisionNewsInterest in TelevisionRespondentInterest in TelevisionHouseholdInterest in Television Courses:Number of WorkingTelevision Sets in the HomeInterest in Television Courses:Cable SubscribersInterest in Television Courses:Quality of VII! vs UHFReceptionInterest in Television Courses:Number of Children in theHomePreferred Subjects Suggested by Potential TV Course -TakersEducation Levels of Female Respondents In ComparisonWith Education Levels of Orange County ResidentsFemales Able to Identify A Ptatite Tolevigion gt4t/onby

10 Level 41f RamsnrionCourses:Source of Ora
Level 41f RamsnrionCourses:Source of Orange CountyCourses:Last Grade Completed byCourses:Occupation of Head ofiv31323233343435363637383940 KOCE, Channel 50, is a noncommercial educational television stationserving Orange County, California.The station began broadcasting inNovember, 1972, serving Orange County with a type of programming Wh/thhad not previously been availableto local audiences.KOCB has embarkedupon a program of extending education by means of broadcasting collegecourses and by public service broadcasting to the Orange County area.In July of 1973, the Corporation for Public Broadcasting awardedROCS a grant to conduct research in audience development and televisioncourse evaluation.The audience development portion of the research pro-ject includes longitudinal audience analysis telephone surveys of OrangeCounty, a study of communication patterns to determine how Orange Countyresidents learned of KOCE, and a series of needs-assessment or ascertain-ment panel discussions o

11 f population group leaders which were su
f population group leaders which were subsequentlyreviewed by larger groups of lay members of each population segment.Thetelevision course evaluation component consists of student course diaries,television viewing log studies, and post-course student surveys.The longitudinal audience analysis telephone component of the researchproject; consists of two telephone canvasses of Orange County.The first,1 2conducted in the fall of 1973, provides a profile of the County's publictelevision viewing audience after KOCE bad been broadcasting for one year.The second, conducted in the fall of 1974, provided data permitting longi-tudinal analysis of the degree to which the county's audience grew innumbers.This report presents the findinse of the first telephone canvass.INITIAL AUDIENCE ANALYSIS TELEPHONE SURVEY'The initial audience analysis telephone survey, conducted in thefall of 1973, identified KOCK viewers in Orange County.It also gatheredinformation to be used in comparing KOCE viewers with

12 nonviewers in termsof demographic charac
nonviewers in termsof demographic characteristics and television program preferences.The information gathered by the telephone canvass focuses on thefollowing areas of interest:I.Orange County public television viewing2.The KOCE audience3.Television coursesProceduresBecause Ma's signal can be received over nearly all of Orange County,the telephone subscribing population of the entire population was taken asour sampling base.One hundred eighty randomly-selected telephone numberswere generated for each of the 93 telephone exchanges serving the county,giving a total sample of 16,740.We anticipated that the sample wouldyield 3,000 actual telephone contacts, of which approximately 300, or telpercent, would be KOCE viewers, that is, those who had watched at leastone program over KOCE. To accomplish this, we pre;ared computer programs which produced 180random four -digit numbers for each of the telephone exchanges serving thecounty.The lists were then attached to a Telephone Call Record to

13 bemaintained by the interviewer calling
bemaintained by the interviewer calling numbers in that exchange (SeeAppendix A).Following this, we separated the telephone records into three groups;one for merning calls, one for afternoon calla, and one for calls in theevening.Telephone numbers for each exchange were distributed into thesegroups in a manner that assured that one-sixth of all numbers would bedialed in the morning, one-third in the afternoon and one-half in theevening.Telephone interviewers dialed each bomber on the Telephone CallRecord in sequence.Upon establishing contact, the interviewers asked thequestions appearing on the Telephone Canvass Form, Appendix B.Becauseapproximately twelve percent of Orange County's population is Spanish sr-named, the questionnaire was translated into local idiomatic Spanish.Onebilingual interviewer was on duty during the evening calling sessions.This interviewer called back those Spanish-speaking persons contactedduring the day and interviewed Spanish-speaking persons contacted in t

14 he'evening at the time of the contact.Al
he'evening at the time of the contact.Although 57 Spanish-speaking personswere contacted, we found it necessary to conduct the interview in Spanishon only sixteen occasions.We conducted the telephone interviews for six weeks starting in thesecond week of September, 1973.tuterviewers worked from 9:00 a.m. until9:00 p.m. Tuesday through Thursday and 9:00 a.m. through 5:00 p.m. onMonday and Friday.On each of these days, one interviewer worked in 4the mornings, and two in the afternoons.Six interviewers worked onTuesday through Thursday evenings.Altogether, the interviewers dialed each of the saupled telephonenumbers at least twice, with the exception of numbers within exchangeswhich the telephone company had assigned exclusively to a particularbusiness firm or government agency./roe these calls, we made a totalof 2,873 contacts, of which 645 or 22.4 percent could be classified asKOCH viewers by virtue of the respondent having watched at least oneprogram broadcest by the station.Responde

15 nt GrsTable I shows the geogrphic distri
nt GrsTable I shows the geogrphic distribution of that 89 percent of theOrange County population who live in incorporated areas and fox whom wecould best estimate places of residence which correspond with telephoneexchange areas.The table also shows the number of respondents whoerecontacted in each area.The data Judie:Atte that the respondent group wassomewhat overrepresentative in the areas of Anaheim, Laguna Beach,Placentia and Santa Ana.It WAS underrepresentative in Buena Park, Ful-lerton, Huntington Beach and San Clemente.Table II shows the comparative distributions of the Orange Countypopulation and the respondent group in terms of types of occupation.Ascompared with the county as a whole, the respondent group is somewhatoverrepresented in professional occupations and in "other" occupations,which includes the military, farmers, and students for the respondentsbut not for the county population.The respondent group is underrepre-sented in the skilled and unskilled occupations. 5Ja

16 nuary, 1973Population*Res o....pnclsttsL
nuary, 1973Population*Res o....pnclsttsLit ,y &Laelies_.1....No%Anaheim221,96015.534118.8Brea21,7621.5451.6Buena Park63,1304.41093.8Fullerton134,5459.41635.7Garden Grove125,4318.72027.0Huntington Beach222,62915.532911.5Laguna Beach15,0751.0602.1Newport Beach117,4318.22498.7Orange107,7947.52037.1Placentia27,8031.91174.1Santa Ana235,21816.458520.4San Clemente26,6251.8361.2Westminster8.12308.0Total, Incorporated_,116,182Areas1,435,585100.02,869100.0No City Assigned4Total Sample2,873*Estimated from 1970 U.S. Census dataTABLE IDistribution of Orange County Populationand Survey Respondents OccupationOrange CotY01,J21.XProfessional107 54324.3Managerial58,68713.3Sales/clarical53,56712.1Skilled workers.158,32535.8Unskilled workers62,07014.1Other0.4Total In-Labor Force441,753_100.01970 CensusTABLE itOccupation of Mead of Vousehold:Respondents've Orande Countylegoedents92232.130710.729210.270724.61194.152618.32,873100.0Table ttt cospares the number of years of education completed bypersons in O

17 range County who are over 25 years of ag
range County who are over 25 years of age with that completedby the heads of households of the respondent group and with the actualtelephone respondent hitaelf.Judging from these data, the respondentgroup is somewhat overrepresentative of those persons who have completedmore than twelve years of education.The data in Table IV suggest that the respondent group is somewhatweighted in favor or those households with children under eighteen yearsof age.Whereas about half of the Orange County households includedchildren under eighteen years of age, nearly sixty percent of the house-holds represented by the respondent group did.Tables I through IV have been presented in an effort to illustratethe degree to which the respondent group, drawn randomly from all Orange Orange CountyActualRespondents,No.XHeads ofHouseholdsNo..XNo.,Years of EducationCompleted*0 - 8 years96,28313.11174.11103.89 - 12 years377,14451.31,23242.991131.7More than 12 years261,85835.61,38348.11,70959.5No answer040440010400

18 4440040.0100004441414.91435.0Total735,28
4440040.0100004441414.91435.0Total735,285100.02,873100.02,873100.0*Data oa Orange County persons 25 years of age and older, 1970 U.S. CensusTABLE II/Education of Head of HouseholdRespondents vs Orange County PopulationHouseholds with children underOrange County*Respondents,No.XNo.X18 years of age220,74050.61,71259.6Households with no childrenunder 18 years of age2151801.161.40,4Total Households436,120.49.4100.02,873100.01970 U.S. CensusTABLE IVNumber of Children In Household.Less Than Eighteen Years of Age:Respondents vs Orange County 8County households with telephones, represented the Orange Countypopulation in terms of four characteristics of itterest to a public,educational television station:geographic distribution,. occupation ofhousehold heads, education of household heads, and number of householdswith school-age children.To the extant that 1970 U.S. census data couldbe compared with information available for the respondentgroup, therepresentativeness of the group is fair.In ma

19 king the comparisons shown in Table I th
king the comparisons shown in Table I through III, however, anumber of coemmises were necessary.In Table I, for example, we coulduse only those data for Orange County residents who lived in incorporatedareas.This excluded some 179,000 persona, over ten percent of the county'spopulation.In order to estimate the population figures for each of thecity areas with which we could associate telephone exchanges, we had todistribute the population of several cities to those areas shown in TableI.The population of Costa Hese, for example, was distributed one-halfto Newport Beach; one-half to Santa Ana.Similarly, the population ofFountain Valley was allocated to the exchangearea identified by thetelephone company as Huntington Beach.Other compromises were necessary in compiling the data shown inTables II and III.When asking our respondents what the occupation ofthe head of the household was, we did not ascertain whether or not theaead was currently employed.As a consequence, the data in Table I

20 I show,for the county, only those person
I show,for the county, only those persons actually in the work force.Therespondent group data reports occupations whether or not the head wasemployed.In Table III, U.S. census data describe the educational levelof those persons twenty-five years of age or older.Inasmuch as we did not determine the ages of either the telephone respondent or the headsof households for the mepondent group, we cannot make a perfect compari-son hero, either.The data shown in Table IV, hmever, are clear cutand the comparison is valid.All in all, we are safe in concluding from the data appearing inTables I through IV that our respondentgroup is somewhat overrepresen-tative with respect to some Orange County cities, with respect to pro-fessional occupations and those who have completed more formal education,and with respect to families with children under eighteen years of age.The group is underrepresentative with respect to persons in skilled andunskilled occupational those who have completed fewer years of

21 schooling,and with respect to household
schooling,and with respect to households with no children under eighteen years.Data gathered from this grow, then, should be considered in the lightof these nonrepresentative characteristics.ORANGE COUNTY PUBLIC TELEVISION WEW/NGViewing Public TelevisionTable V shows the response to the question, "Can you tell me thenew of the public TV station serving your area?"By beginning with acold unaided identification, we hoped to derive a conservative and there-fore reliable estimate of Public Television (PTV) awareness.Almost half of the respondents believed they could identify a publictelevision station:49.5 percent.But of these, 271 or 19.1 percentincorrectly named a station other than KCET or KOCE, the only PTV stationsserving the area.Most of these named commercial UHF stations, thoughsome cited VHF stations.These 271 represent 9.4 percent of all those 10contacted, indicating that confusion between the terms "public television"and "UHF station" is fairly widespread.After eliminating th

22 ese incor-rect responses, almost 40 perc
ese incor-rect responses, almost 40 percent of the respondents identified Kan or.KOCE without any assistance.The 295 persons who, unassisted, were ableto name KCB alone or in combination with KCET represent 10.3 percent ofthe total sample.TOTALYesNoAll Answering "Yes"No.%No.2No.2_Named KOCE Only1289.0Named KCET Only83858.9Named both KOCE and KCET16711.8Corr. Named a PTVstation1,13379.71,13379.71,13339.4Incorrect "Yes" Answers27119.12719.5Could identify no station171.2170.6Total "Yes" Answers1,421100.01,42149.51,42149.5All Answering "No"1.45150.5mowatwoOw..IrTotal SampleTABLE VRespondents Identifying APublic Television Station2,873 100.0One interesting aspect of the ability to recognize a public televisionstation is its relationship to the sex of the respondeat.Our survey pro-duced 739 male and 1,854 female respondents, with 280 interviews in whichno sex was recorded.As seen in Table VI, there is no important differencebetween the number of men and women who were able to identify a pu

23 blictelevision station. 11MaleFemaleUnde
blictelevision station. 11MaleFemaleUndeterminedNo.XNo.uot,.zStation IdentifiedKOCE Only364.9713.8217.1KOCE and KCET506.8975.2207.5KCET Only22430.354629.56824.3Incorrect Identification7810.61608.63311,8Answered "Yes," but couldidentify no station40.5110.620.7Unable to Identify Any3,z.46.9969522.313648.6Total739100.01,854100.0280100.0TABLE VIAbility To identify A Public TV StationsMale vs FemaleTable VII presents comparative data on viewing of the Los Angelespublic TV stations, KCET and KOCE.Question 2 of the Telephone CanvassForm inquires after the reepoddent's own viewing behavior with respect toKOCE.Question 5 elicited information on KCET viewing and was structuredto include the viewing behavior of an indeterminate number of multiple"others" in the respondent's household:"Have you or members of yourfamily ever watched a program on KCET, Channel 28, the Los Angelespublic station?"Table VII therefore, reflects a comparison based ontwo questions which were phrased differently. 12KOCEK

24 OCE ViewersNonviewersNo.%No.2TotalRave w
OCE ViewersNonviewersNo.%No.2TotalRave watched KCET53080.71,27551.51,805 KCET ViewersHave not watched KCET12719.394042.41,067 KCET NonviewersNo answer-10.11 No answerTotal657100.02,216100.02,873TABLE VIIRespondents Viewing KOCE and KCETAs a first point of comparison, nearly three times as many respondentshad seen KCET (1,805) as had seen KOCE (657).The difference is not stir-prising.Indeed, this figure may be a conservative one, when the respec-tive ages of the two stations are considered.Because the "ever" is someten years in length, the question probably missed some number ofrespondents who had simply forgotten watching an earlier KCET program.The number of KCET viewers may well be conservative for a reasonother than presumed forgetfulness on the part of the respondent.Thetelephone interviewers found that the phrase "watchprograms regularly"in Quvition 6 ("Do you or your family watch programs regularly on KCET.Channel 28?") tended to inhibit the response of an indeterminate portion

25 of those who responded "yes" on Question
of those who responded "yes" on Question 5.One thousand eight hundredfive respondents reported that they had watched at least one program overKCET, yet the restriction of "regular viewing" confined program identifi-cation, to be discussed in detail later, to 965 (53.5%) of thoserespondents.Therefore, while we can make a strict comparison of viewing habitsbetween the 965 KCET "regular viewers" and 73 identified KOCE "regular 13viewers,' nevertheless all other comparisons are based on the more generalassumption that,we are tapping the pave basic information, i.e., programsviewed within the fairly recent past and of sufficient impact on therespondent to cause him to remember and name them.From the data reflected in Table VII, then, we conclude that:1.The majority (81 percent) of KOCE viewers are also viewers ofMET.2.Neatly 30 percent (530 out of 1,805) of the KCET viewers havealso watched KOCE.Beyond the factor of relative age difference between the two stations,another point of compari

26 son can be investigated.One might assume
son can be investigated.One might assume fromthe information shown in Table VI/ that the differences in viewingpercentages with regard to KOCE and KCET are exacerbated by the well-knownpopularity of the Public Broadcasting System children's shows.Indeed,data to be presented later indicate that children's program viewing ismore common to KCET than to KOCE.A comrarison of station viewing whichincluded the information gathered from Question 4 ("Has anyone else inyour household watched a program on KOCE, Channel 50 ? ")would go far inequalizing the audience characteristics of both stations, with the factorof chil4ren's programming being discounted.Two hundred seven respondents answered Question 4 affirmatively.Of these, 43 reported that although they personally had never watched aprogram over KOCE, someone else in their household had.We were not ableto determine whether or not these 43 "others" had also watched programsover KCET, however.As a result, we cannot compare viewing percentages

27 between the two stations on the basis of
between the two stations on the basis of this additional information.We 14did, however, obtain specific program information from all 207 affirmativeresponses to Question 4 which responses include those of the 43 additionalviewing households.Including this information with that gathered fromQuestion 2 enabled us to deteraine.the children's programming share ofKOCE's total audience as compared with KCET.This will be discussedlater.Quuaality oOne obvious factor in influencing audienfe development is ease ofaccess to the programming.Because UHF signals are inherently moredifficult to receive well than are VHF signals, all public stations havea common problem.Inasmuch as their transmitters are located separatelyand are of different output capacity, one &fight expect that hose receptionquality might differ for KOCE and KCET.Because of this expectation, andbecause it has been demonstrated that the likelihood of viewing PTV is,iu part, a function of perceived quality of reception, we asked o

28 urrespondents the following as part of Q
urrespondents the following as part of Question 2:"Row is the reception(of KOCE) compared to other stations you watch the most?"As shown inTable VIII, over 70 percent of the KOCE viewers consider the station'sreception to be at least on a par with the rest of the stations theyreceive.Since the question did not stipulate specifically what thebasis of comparison should be, the implication was (purposely) that theywere to contrast KOCE reception to that of the commercial VHF stationsin Los Angeles. 15KOCEViewersNo.%AllRespondentsNo.Nave WatcheKOCE657100.065722.8Reception not as good18428.0Reception* as good41262.7Reception better619.3Have Not Watched KOCE2 21677.2Total2,873100.0TABLE VIIIKOCE Viewers Perceptionof Quality of UHF ReceptionWe also asked the respondents if they subscribed to cable television.As shown in Table IX, only five percent indicated that they did.Ofthese 192 homes, 16 percent were KOCE viewers and 84 percent were non-viewers.Anong KOCE viewers, five percent had cabl

29 e in their homes, whileamong nonviewere,
e in their homes, whileamong nonviewere, seven percent did.On the basis of this information,we conclude that household cable service plays no significant part inperceived quality of television reception.KOCEKOCEViewersNonviewersNo.%No.TotalSubscribers3015.616284.4192100.0Nonsubscribers61723.52,00876.52,625100.0No answer1017.94682.156100.0Total6572,2162,873TABLE IXCable TelevisionService Subscribers 16Because Table X shows no difference in assessment of picture qualitybetween viewers of, the two available public stations, we light concludethat picture quality is unrelated to PTV viewing behavior.This conclu-sion overlooks that segment of the population which cannot receive UHFstations at all.One possible oversight in the questionnaire was theomission of a question designed to elicit this information, e.g., "Doyou receive UHF stations at all?"Some of the respondents volunteeredthat they were unable to get UHF and some of the telephone interviewersindicated this on either Ole Telephone

30 Call Record or the Telephone CanvassForm
Call Record or the Telephone CanvassForm.There is no way, however, in which this information can be system-atically tabulated.We do know that industry estimates peg the UHFreception capacity at about 80% of existing VHF reception.KOCE ViewersKCET ViewersNo.%No.%Not as good18428.051028.3As good41262.71,07959.7Better619.321612.0Total657100.01,805100.0TABLE XPTV Reception Quality InOrange CountyAmount of Television UseBoth to validate the effectiveness of the sampling and the researchinstrument, and to obtain an assessment of television viewing in OrangeCounty, we asked our respondents Question 9:"Now on another subject,about how many hours. would you say your television set is playing duringthe average day?"Table XI shows the results.There are no 17KOCE ViewersNo.%KOCE NonviewersNo%TotalNo.12 hours8312.632414.640714.236 hours36755.91,26557.11,63256.87 - 9 hours10315.727612.537913.210 - 12 hours659.91918.62568.913 ov more hours314.71074.81384.8No answer81.2532.4612.1Total657100.02,21610

31 0.02,873100.0TABLE XIHours of Television
0.02,873100.0TABLE XIHours of TelevisionSet Operationsubstantial differences between KOCE viewers and nonviewers interms ofamount of time home television sets were turned on during the averageday.Over eighty-five percent of the respoddent group had their sets turnedon more than two hours per day and twenty-nine percent had them turnedon more than six.Numbers ofPersons_One hour1520.8Two hours1625.0Three hours1419.4Four hours45.6Five hours or more2129.2Total72100.0TABLE XttWeekly Vtewing of KOCEby Heavy ViewersRespondents who identified three or more KOCE viewed programs byname and who, consequently, might be considered as "heavy viewers," wereasked Question 2a:"How many hours per week do you watch KOCE?"Table XII 18shows the responses.About 45 percent of such persons watch KOCE Oneor two hours per week.A surprising number reported that they watchedKOCE broadcasts fiVe or more hours per week:29.22THE KOCE AUDIENCEKOCE ViewersThe second question on the Telephone Canvass Form asked, "Hav

32 e youever watched a program on KOCE, Cha
e youever watched a program on KOCE, Channel 50, the Orange County public sta-tion?"This question limits its consideration to the respondent's ownbehavior.However, we asked a parallel question concerning the KOCEviewing of other persona in the household, Question 4.The viewingrespondents cited 207 such supplementary instances.Thus, 20 percent ofthe viewing homes had known viewers other than the respondent.In addi-tion, the data reveal 43 households out of the 207 in which the respondenthad never watched a program on KOCE, but where some other person of theresidence had.Therefore, the best overall estimate of KOCE's share OfOrange County's viewing audience is thus:657 + 43700 households,or 24.4 percent.AgarlOic DistributionThe geographic distribution of KOCE viewers is shown on the map inFigure I and in Table XIII.Table XIII shows the KOCE viewers of eachcity as a percentage of the total respondents contacted in that city.Asan operational definition, a "KOCE viewer" is a respondent wh

33 o reportedwatching at least one program
o reportedwatching at least one program broadcast by the station.Host cities showpercentage viewership approximately equal to the county average of 22.9percent.Laguna Beach and San Clemente, however, which lie in the 20southern part of the county and are largely sheltered from KOCE'sbroadcast antenna by coastal hills, have lower proportions of viewers.The same is true for Placentia, located in the hilly eastern part of thecounty.Huntington Beach, the location of KOCE's studios, has a some-what higher rate of viewership than other cities.With these exceptions,.KOCE viewership is fairly evenly distributed throughout the county.TotalRespondentsViewersCity/Area*No.No.%Anaheim54110920.1Brea431124.4Buena Park1092926.6Fullerton1633923.9Garden Grove2025225.7Huntington Beach3299528.8Laguna Beach6058.3Newport Beach2495923.7Orange2034723.2Placentia1172117.9Santa Ma58513422.9San Clemente36513.9Westminster2305122.2No city assigned4Total2,87365722.9*Some Orange County cities are not listed here, s

34 ince thetelephone company treats them as
ince thetelephone company treats them as part of another city; e.g.,Costa Mesa, which lies partly within the Santa Ana dialingzone and partly in that of Newport BeachTABLE XIIICity Distribution of Respondentsand Viewers 21KOCE Viewer ProfileAs is customary in audience evaluations, a set of demographicdescriptions has been compiled for respondents who have been classifiedas KOCE viewers, that is, those who reported watching at leaet one pro-gram broadcast by the station.,Tables XIV through XIX provide a profileof the KOCE audience in the fall of 1973, after the station had beenbroadcasting for one year.These data describe KOCE viewers as typicallyof professional or proprietorial occupations (Table XIV), having com-pleted more than 12 years of formal education (Table XV), having childrenin the household who are younger than 18 years of age (Table XVI), havingmore than ace television set (TableXVII), and typically find that theirVHF television reception is better than their UHF receptio

35 n (Table XVIII).They get most of their O
n (Table XVIII).They get most of their Orange County news from the newspapers (Table XIX)and do not subscribe to cable television services (Table IX).In general, the profile for KOCE viewers does not differ markedlyfrom that of KOCE nonviewera.KOCE viewers as a group seem somewhatmore frequently to be professional workers, to have completed a few moreyears of formal schooling, to have fewer children less than seven yearsof age in the household, to have more television sets and to perceivetheir VHF and UHF television reception to be more nearly equal in qualitythan do their nonviewer counterparts.A slightly smaller proportion ofKOCE viewers are cable service subscribers than is true for KOCE non-viewers.These differences cannot be used to clearly differentiate KOCEviewers from nonviewers, however.The follow-up telephone canvass to beconducted in the fall of 1974 may, if these slight differences persistor increase in magnatude, provide data thatan be more adequately usedfor this purpos

36 e. 22OccupationKOCE ViewersNo.XKOCE Nonv
e. 22OccupationKOCE ViewersNo.XKOCE NonvieweraNo.XProfessional26039.666229.9Proprietorship/Managerial578.725011.3Sales/Clerical649.722810.3Skilled Labor14321.856425.4Unskilled Labor253.8944.2Others10816.441818.9Total657100.02,216100.0TABLE XIVOccupation of the Headof the. household'lUndifferentiatedas to sexGrade LevelKOCE ViewersNo. XKOCE NonviewersNo.X1 - 8 years223.3884.09 - 12 years17126.074033.413 - 14 years16124.549022.115 - 16 years14622.247321.317 or Nora years12018.331914.4Refused to answer375.61064.8Total657100.02,216100.0TABLE XVEducation of the Headof the Household 23KOCE ViewerhouseholdNo7:KOCE NonviewerHouseholdNo.%TotalNo.ZNo children under 25 years18719.577180.5958100.0Chi1iren 18 - 25 years5626.715473.3210100.0Children 18 - 25 yearsand under 17 years8725.425674.6343100.0Children under 18 years28722.01,01578.01,302100.0Total6172,1962,813Data Unavailable402060Total Sample6572,2162,873TABLE XVIChildren in the HouseholdsKOCE ViewersNo.%KOCH NonviewersNo.ZOne se.:25138.21

37 ,00045.1Two sfAs26239.987039.2Three sets
,00045.1Two sfAs26239.987039.2Three sets10115.422210.0Four sets223.3492.2Five or more sets81.2351.6No answer132.0401.8Total657100.02,216100.0TABLE XVIINumber of Television Setsin the Household ReceptionKOCE ViewersNoyVHF best42364.4UHF best294.4Equal19229.2Don't know132.0Total657100.01\TABLE XVIIIReception Quality:VHF vs UHFKOCE NonviewersNo.1,64074.0823.744019.82.42,216100.0SourceKOCE ViewersNo.xKOCE NonviewersNo.ZNewspaper45168.61,44565.2Radio365.51757.9Television13720.846821.1Conversation182.7592.7No answer152.3693.1Total657100.02,216100.0TABLE XIXSource of Orange County News24 Programs Recalled by KOCE ViewersFrom the 657 KOCE viewers, we obtained 345 mentions of 110 programs.These programs were identified by title, e.g., Masterpiece Theatre, andMister Rogers.The balance is divided between those programs identifiedby program topic, e.g., "economics," and those named in more generalterms, such as "plays" and "children's shows."We designated as "regular viewers of KOCE" those respo

38 ndents whoidentified three or more progr
ndents whoidentified three or more programs watched on the station.Of our basenumber of 657, 73 or 11.1 percent are thus categorized.Because theserespondents were responsible for mentioning over half (54 percent) of theviewing instances, the remainder was accounted for by an additional 144persons.In other words, 440 of the 657 viewers did not furnish us withprogram information in their response to Question 2.ProgramMo. ofMentions2Sesame Street4826.9Orange County Focus2312.9Psychology*2011.2Panel discussions116.2Watergate95.0Consumer Contest*95.0Art95.0Masterpiece Theatre95.0Electric Company95.0Mister Rogers84.5Ballet73.9Boston Pops63.4Law course*52.8History52.8Total178100.0*TelecoursesTABLE XXMost Frequently ViewedPrograms on KOCE25 26Tables XX and XXI show the 15 moat frequently viewed programs onKOCE* and the ranking of viewing categories by frequency of mention.Ofthe 15 most frequently mentioned programs, three are telecourses, whichindicate that KOCE is beginning to establish its

39 function of collegecourse broadcasting.
function of collegecourse broadcasting.The appearance of 2ramolojealacat as the secondmost often mentioned program seems to indicate - -again--that KOCE isgaining audience awareness in another major area of commitment: that ofairing Orange County-based activities and issues.These observations arestrengthened by the appearance'of "Educational/How To" in Table XXI asthe most often viewed program category.CategoryTotalNo ofMelaka2Educational/How To8725.2Public Relations/Documentaries(including Orange County)8223.8Children's programs7922.9Musical programs4713.6Drama presentations257.2Miscellaneous123.5Nature/Travel programs72.0Sports61.7345100.0TABLE XXIKOCE Viewing Categoriesby Frequency of Mention*A complete listing of programs by number of viewing instances andconsistent parts of the KOCE viewing audience is found in Appendix C. 27The KCET list of most frequently viewed prograra and the ranking ofviewing categories by frequency of ugation are Maim in Tables XXIXandXXIII.Compared with

40 Tables XX andXXI, showing KOCE viewing
Tables XX andXXI, showing KOCE viewing frequencies,one difference is immediately obvious.While Sesame Street was the mostoften viewed program on both stations, it constituted over 40 percent ofthe total viewing instances on KCET and little more than a quarter (26.9percent) of those for KOCE.While the latter statistic reflects thequalification of only the respondent's behavior in the structure of Ques-tion 2, the addition of 44 Sesame Street mentions obtained in the responseto Question number 4 ("Has anyone else in your household watched a pro-1!,:am on KOCE, Chanuel 50?") raises the number of Sesame Street mentionsto 92, or 30.4 percent of all KOCE programs mentioned as being watchedeither by the respondent or by a member of his family.This inclusionwould tend to equalize the KOCE viewing audience with that of KCET, andmake more reliable the statement that children's programs are viewed moreon KCET than KOCE.When we compare the order of viewing categories for both stations,we see fr

41 om Tables XXI and XXIII that, while chil
om Tables XXI and XXIII that, while children's programmingreceived top ranking (57 percent) on KCET, it is superseded on KOCE (22.9percent) by the categories of education (25.2 percent) and public relations/documentaries (23.8 percent).If one includes the "other viewer" responsesto Question number 4, as shown in Table XX/V, the category of children'sprogramming for KOCE nearly doubles - -from 79 to 145--and becomes 30.8percent of all viewing instances on the station.Seen in this light,children's program, would then rank first by viewing frequency for KOCEbut remain a smaller percentage of programs mentioned than is true forKCET. ProgramNo. ofMentionsZSesame Street52141.6Mister Rogers17413.9Electric Company1028.2Masterpiece Theatre725.8Watergate665.3Hodge Podge Lodge554.4Boston Pope514.1Specials443.5Plays292.3Henry VIII272.2Musical programs252.0American Family231.8Drama231.8Movies201.6Concerts191.5TotalTABLE XXIIMost Frequently ViewedPrograms on KCET1,251100.028CategoryNo. ofMentionsC

42 hildren's programs89257.0Public Relation
hildren's programs89257.0Public Relations/Documentaries17911.4Drama presentations17311.1Musical programs1298.2EdueAtional/How to865.5Miscellaneous805.1Nature/Travel140.9Sports120.8Total1,565100.0TABLE XXIIIKCET Viewing Categoriesby Frequency of Mention 29CategoryChildren's programs796614530.9Public Relations/Documentaries(including Orange County)822110321.9Educational/How To87129921.1Musical programs47105712.1Drama258337.0Miscellaneous126183.8Nature/Travel7291.9Sports6061.3Total345125470100.0TotalQuestionQuestionTwoPourNo._XTABLE XXIVTotal KOCE Viewing Categories,Questions 2 and 4Table XXV summarizes the comparison of program categories for bothstations.On this basis, the first two categories, children's programsand public relations/documentaries, rank the same on both stations.Educational programs command the 3rd most frequently viewed category withKOCE viewers, while they are 5th with KCET viewers.CategoryTotalChildren's programs57.033.9Public Relations/Documentaries11.421.9Educati

43 onal/How to5.521.1Musical programs8.212.
onal/How to5.521.1Musical programs8.212.1Drama presentations11.17.0Miscellaneous5.13.8Nature/Travel0.91.9Sports0.81.3Viewed on KCETViewed on KOCEXX100.0100.0TABLE XXVOrange County Public TelevisionViewing Categories Table XXVI summarizes, by name, the programs viewed on both KOCEand KCET.The column for KOCE includes programs mentioned in response toboth Questions 2 and 4 of the Telephone Canvass Form.The fifteen mostfrequently mentioned programs are shown in rank order by total number ofmentions.Sesame Street heads the list as the most frequently mentionedprogram and is the leading program in terms of popularity for both KOCEand KCET.In general, the program priority rankings for the two stationsdo not differ substantially even though rankings of program categories do.ProgramTotalKCETKOCEMentionsMentionsMentionsSesame Street61342.352142.39242.2Mister Rogers18913.017414.1156.9Electric Company1188.11028.3167.3Masterpiece Theatre825.7725.8104.6Watergate755.2665.494.1Boston Pops594.1514.1

44 83.7Hodge Podge Lodge553.8554.5-Musical
83.7Hodge Podge Lodge553.8554.5-Musical programs493.4252.02411.0Specials473.2443.631.4Plays352.4292.462.8Henry VIII302.1272.231.4Orange County Focus*281.92812.6Drama251.7231.920.9American Family231.6231.9Concerts21jai191.520.9No.RNo.XTdo.%Total1,449100.01,231100.0218100.0*Not offered on KCETTABLE XXVIKCET and KOCEViewed Programs30 31TELEVISION COURSESAwareqess of KOCE TelecoursesInasmuch as the broadcasting of televised college courses for creditis KOCE's major responsibility, the extent of awareness that such coursesare available is important.As seen isXXVII, about 31 percent ofall respondents said they knew about television course offerings.Whenasked how they found out about such courses, a large proportion citednewspapers as their source of information.As might be expected, alarger percentage of KOCE viewers than nonviewers are aware of creditcourses.Of the 657 KOCE viewers, 332 or 502, had heard of the televisedcourses; while of the 2,207 nonviewers only 537 or 242 said they knew

45 about such courses.Know About Television
about such courses.Know About Television Courses?Yes:from what source?No.No.%30.6881Newspaper23326.4Television15317.4A friend14816.8Brochure on campus11713.3Other/miscellaneous11613.2Mailed brochure10011.4Radio141.6881100.0No1 99269.4Total2,873100.0TABLE XXVIIRespondent Knowledge of Telecourses 3211roLULLIterestinErlinTelecoursesHalf of the total respondents answered "yes" to Question 8, "Do youthink you would ever like to enroll in a course over television?"Pur-suing an interest in identifying characteristics of potential televisioncourse takers, we compared potential takers with potential nontakers.Tables XXVIII through XXXV show the results.NotInterestedInterestedNo AnswerTotalNo.2No.2No.XNo.2KOCE Viewer37557.127642.060.9657100.0KOCE Nonviewer1.05147.41115252.0130.62,216100.0Total1,4261,428192,873TABLE XXVIIIInterest in Television Courses:KOCE Viewers vs WonviewersInterestedNotInterestedNo AnswerTotalNo.7.No.%No.2No.%Hours of TV Set Operation1 - 2 hours18645.721953.820.5407100.03

46 - 6 hours81349.881449.950.31,632100.07 -
- 6 hours81349.881449.950.31,632100.07 - 9 hours19250.618649.110.3379100.010 - 12 house13954.311645.310.4256100.013 or more7755.86144.2--138100.0No answer1931.13252.51016.461100.0Total1,4261,428192,873TABLE XXIXInterest in Television Courses:Amount of Daily TV Operation 33Judging from Table XXVIII, more KOCE viewers than KOCE nonviewersare Interested in taking television courses.Table XXIX shows thatinterest in taking television courses increases with the number of hoursthat television is operating in the home.Thus, the confirmed televisionenthusiast is more likely to be interested in television courses than issomeone less attracted to television as a communications medium.OPSourceInterestedNo.%NotInterestedNo.%No AnswerNo.TotalNewspaper95250.293949.550:31,896100.0Radio10147.911052.1211100.0Television31451.928747.440:7605100.0Conversation3241.64558.477100.0No answer2732.14756.01011.984100.0Total1,4261,428192,873TABLE XXXInterest in Television Courses:Source of Orange County NewsAccor

47 ding to Table XXX, those who get their O
ding to Table XXX, those who get their Orange County news fromconversation are typically less interested in taking television coursesthah are those who get their news over television or from the newspapers.The data in Table XXXI suggest that the more education a person has themore likely he is to be interested in courses over television.Only 35%of those with 8th grade education or less are interested in televisioncourses as compared with 51.8% of those with two to four years of college. 34NotInterestedInterestedNo AnswerTotalNo.%No.No.%No.%Grade Completed1 - 84135.07463.221.8117100.09 - 1258647.664452.320.11,232100.013 - 1441758.329741.510.2715100.015 - 1622051.820347.820.4425100.017 or more11647.712551.520.8243100.0No answer4632.68560.3107.1)41100.0Total1,4261,428192,873TABLE XXXIInterest in Television Courses:Last Grade Completed by RespondentPersons in the sales/clerical occupations seem to be more interestedin taking television courses than any other single occupation1 group.Assh

48 own in Table XXXII, over 572 of the resp
own in Table XXXII, over 572 of the respondents in those occupationsreported being interested in taking television courses.NotInterestedInterestedNo AnswerTotalNo.ItNo.No.%No.OccupationProfessional48852.943146.730.4922100.0Proprietorial/Managerial16553.714145.910.3307100.0Sales/Clerical16757.212542.8292100.0Skilled Labor35950.834749.110.1707100.0Unskilled Labor5747.96141.210.8119100.0Other19036.13231.4132.5526100.0Total1,4261,428192,873TABLE XXXIIInterest in Television Courses:Occupation of Head of Household 35There is only slight evidence that those families with more thanone television set are more interested in taking television courses thanare those with only one (Table XXXIII).Persons who subscribe to cabletelevision satvices typically are also more interested in enrolling intelevision courses but the percentage difference between subscribers andnonsubscribers is not great (Table XXXIV).Those who report that UHFreception is about equal in quality to VHF reception also report sli

49 ghtlymore interest in enrolling in telev
ghtlymore interest in enrolling in television courses than those who feel VHFis best (Table XXXV).As shown in Table xxxvr, families with all children under the ageof 25 seem more interested in taking television courses than not, althoughthe number of young children apparently bears no relationship to thatinterest.InterestedNo.%NotInterestedNo.XNo AnswerNo.2TotalNo.%Working Sets160948.763951.130.21,251100.0257851.154848.450.41,131100.0316250.216049.510.3323100.044462.02738.0--71100.05 or more2211.22148.8--43100.0No answer1120.3361.11018.554100.0Total1,4261,428192,873TABLE XXXIIIInterest in Television Courses:Number of Working Television Sets in the Home 36NotInterestedInterestedNo AvowerTotalNo.2No.2No%No.%Subscribert11157.87941.221.0192100.0Nonsubscribera1,30149.61,31650.180.32,625100.0No answer1425.03358.9916.156100.0Total1,4261,428192,873TABLE XXXIVInterest in Television Courses:Cable SubscribersReceptionInterestedNo.2NotInterestedNo.2No AnswerNo.2TotalNo.%VHF beat4439.6670.4--1111

50 00.0UHF best1,01249.1.1,04450.670.32,063
00.0UHF best1,01249.1.1,04450.670.32,063100.0Equal34754.928444.910.2632100.0No answer2334.33349.31116.467100.0Total1,4261,428192,873TABLE XXXVInterest in Television Courses:Quality of VHF vs UHP Reception NotNotInterestedInterestedInterestedInterestedNo AnswerTotalsNo.Number of Children Under 18No.2No.INo.2No.INo.I122732.417429.21-402225937.022938.41-489312517.811920.01-2454598.4488.01-1085182.671.2--256 or more101.4183.0--28Indeterminate30.410.21-5Total, Children Under 18701100.0596100.070150.059642.851,302Children both Under 18 and18 to 2518754.51564:5.5343100.0Children 18 to 2510449.510650.5210100.0No Children Under 2541142.953655.9111.1958100.0Totals1,4031,394162,813Data Unavailable60Total2,873TABLE XXXVIInterest in Television Courses:Number of Children in the Home 38All those who said "Yes," they would like to enroll in a televisioncourse, were asked, "What kind of subject would interest you most?"Thecomplete table of their responses will be found in Appendix D.TableXXXVII, show

51 ing their preferences by subject categor
ing their preferences by subject category, indicates thatinterest is highest in the social sciences, fine and applied arts,literature and languages, and consumer and health services.CategoryMentionsNo.2Social Sciences38728.4Fine & Applied Arts26919.7Literature & Languages19414.2Consumer & Health Services17012.5Business1228.9Physical Sciences & Math1158.4Technology433.2Agriculture & BiologicalSciences342.5'Health Sciences & PhysicalEducation231.7General Education70.5Total1,364100.0TABLE XXXVIIPreferred Subjects Suggestedby Potential TV Course-TakersOther phases of the research project have suggested that women mightconstitute an identifiable audience for telecourses.Therefore, we deter-mined the ratio of men to women who reported that they were interested intaking courses over television.Of the 739 men interviewed by our tele-phone canvassers, 362 or 48.92 reported that they were interested inenrolling for college courses over television.Nine hundred seventy-eight 39out of 1,854 women

52 , or 52.8%, said that they were interest
, or 52.8%, said that they were interested.Thisproportional difference is not substantial but it does indicate that morewomen are interested in taking college courses by television than is truefor men.KOCE is interested in women as a target population for televisioncourses.Our data allowed us to make comparisons between the general levelof education in Orange Countyas recorded in the 1970 U.S. Census and thelevel of education of the survey's female respondents.Level of EducationRespondentsFemaleNo.XCountyResidentsNo.%1 - 4 years100.59,9241.35 - 7 years241.329,8304.18 years542.950,1906.89 - 11 years18610.0120,29716.412 years69937.7256,84734.913 - 15 years55429.9145,36019.816 or more years27014.6116,49815.8No answer573.16,3390.9Total1,854100.0735,285100.0TABLE XXXV//iEducation Levels of Female RespondentsIn Comparison WithEducation Levels of Orange County ResidentsJudging from Table XXXVIII, it is apparent that our female respondentshave completed more education than the Orange County

53 population as a whole.However, census ed
population as a whole.However, census education figures apply to persons 25 years and older,while we made no such differentiation.Table XXXIX shows that, as withthe respondent group taken altogether, the more education that women have,the more likely they are to be able to identify a public television station. All WhoAnswered"Yes"KOCE OnlyOnlyKOCE GKCET"Yes" butIncorrector no I.D.All WhoAnswered"No"KCETNo.INo.%No.2No.2No.2No.2Years of Education1 - 8 years351.940.280.440.2191.0532.99 - 12 years35819.3301.620611.1271.5955.152828.613 - 14 years25413.7211.11658.9351.9311.822512.115 - 16 years1417.680.41065.7181.090.4985.317 or more years653.540.2442.490.580.5402.2No answer321.740.2170.940.270.4251.4TABLE XXXIXFemales Able to Identifya Public Television Stationby Level of Education 41CO4CLUSIONSAfter its first year of broadcasting, KOCE shows an Orange Countymarket penetration of 24.4 percent.By all standards, this is an impres-sive record.Although only about one in ten households could i

54 dentifyKOCE by call letter or channel id
dentifyKOCE by call letter or channel identification, nearly one out of fourhad tuned in to a KOCE broadcast at leastonce during its first year ofoperation.A profile of the typical KOCE viewer shows him to be not unlike whathas become the stereotype public television viewer.He is a professionalor proprietorial person who has completed more than 12 years of formaleducation.He has children in his household younger than 18 years ofage and owns more than one television set.Such demographic differencescannot be used to differentiate between KOCE viewers and nonviewers,nevertheless, these characteistics paint a picture of the KOCE viewerthat is what we have come to expect public television watchers to be.Orange County is currently served by two public television stations:KOCE, based in the county itself, and KCET, located in Los Angeles.Ourinterviews of Orange County residents yielded an interesting differencein station image when we inquired as to those programs watched over thetwo statio

55 ns.KCET is seen more as a source of chil
ns.KCET is seen more as a source of children's programs thanis KOCE, even though children's programming is foremost in viewing fre-quencies for both stations.It would seem that the broadcasting of tele-vision courses over KOCE has had the effect of making children'sprogramming a less important component of K0C5's programming compared toKCET's.Inasmuch as television courses had been offered by KOCE onlyfor six sonths prior to the telephone survey, one would presume that the 42follow-up survey conducted in the fall of 1974 would show KOCE'schildren's programming relegated to less than primary popularity becauseof the increased emphasis on television courses during the interveningyear.About one-third of all Orange County residents know about televisioncourses and the most frequently cited source of information about themseems to be newspapers.This is interesting in the light of the factthat relatively few promotional efforts concerning television courseshad been expended prior to the fa

56 ll, 1973 telephone survey.Once againlook
ll, 1973 telephone survey.Once againlooking to the future, the fall, 1974 survey conducted after considerablymore extensive promotional efforts may yield an even greater proportionof Orange County residents who know about the courses.Judging from our respondents, interest in television courses tendstoward those things which pertain to the quality of life:fine arts,literature and languages, and consumer and health services.More esotericsubjects, such as physical sciences and mathematics, as well as trulypragmatic areas, such as business and technical training were not seenas important.Inasmuch as the telephone survey reported in these pages is thefirst of two designed to assess the longitudinal market penetration of anew television station, profound conclusions about audience buildingactivities, audience characteristics, and viewing habits should await theconclusion of the second part of the study.The proceeding paragraphs,however, give a strong sense of direction as to how we expect

57 the totalpicture to look at the conclusi
the totalpicture to look at the conclusion of the second phase of the audienceanalysis. APPENDIX A COAST COMMUNITY COLLEGE DISTRICTPhone Call RecordMeted CallsCall BacksX - Interview Complete--Adult Only6- No Eligible Respondent,this time1 - Not a Working Number7- Line Busy (Try again in10-15 min.)2- Nonresidential Number8- No Answer3- Refused9- Resp9ndent Not Home or Busy4- No Television in Household5- Language BarrierTelephoneNumber(ht or F)DateTimeCodeFirst CallSecond CallDateTimeCodeDateTimeCode.Third Call0101111. 11le011111...=1,.........*..-........... APPENDIX B Initial,Respondent Sex (M-F)COAST COMMUNITY COLLEGE DISTRICTKOCE-Channel 50 Longitudinal Audience SurveyTelephone Canvass FormInitial Survey, Fall, 1973-74Hello, I'm calling from Golden West and Orange Coast Colleges.We're doing asurvey of what people watch on educational television.May we ask you a few questions?If No:Thank you - Hang upIf Yes, write telephone nuliber:then continue with questions.1.Can you tell me the

58 name of the public TV stations serving
name of the public TV stations serving your area?1.Yes:write call letters:2.No1.Have you ever watched a program on KOCE-, Channel 50, the Orange Countypublic station?Yes:How is the reception compared to other stations you watch most?1.Not as good2.As good3.BetterWhich programs have you watched this year?4.No2a.If three or More programs were named for qUestion #2, ask:How many hours per week do you watch KOCE?Do you watch any programs on KOCE, Channel 50 regularly?1.Yes:If Yes:Which?2.3.Has anyone else in your 'household watched programs on KOCE,Channel 50?1,yas;If Yes:Which programs have they watched?2.No5.Have you or members of your family ever watched a program onKCET, Channel 28, the Los Angeles public station?Yes:How is the reception compared to other stations?1.Not as good2.As good3.Better4.No.Do you or your family watch programs regularly on KCET,Channel 28?1.Yes:If Yes:Which? Whir.h prog-ams have you watchedthis year4.No2a.If t7IIPCC OP WPC prognr:s !,,erenoPod for question #

59 2, ask:How many hours per week do youwat
2, ask:How many hours per week do youwatch KOCE?3.Do you watch any programs onKOCE, Channel 50 regularly?1.Yes:If Yes:Which?2.No2a3111.4.Has anyone else in yourhousehold watched programs onKOCE,Channel 50?1.Yes:If Yes:Which programs have they watched?2.No45.Have you or members of yourfamily ever watched a program onKCET, Channel 28, the LosAngeles public station?Yes:How is the reception comparedto other stations?1.Not as good2.As good3.Better4.No6.Do you or your familywatch programs regularly onKCET,Channel 28?1.Yes:If Yea:Which?2.567.Have you heard thatKOCE, Channel 50 offers highschool or collegecourses overtelevision that you can take athome?Yes:How?1.Friend2.Radio3.Television4.Newspaper5.Mail brochure6.Brochure picked up oncampus7.Other:B.No 010 co: to qui/S)7LI 7a.(Only if "yes" to question 10)Have you watched any parts ofthese courses?1.Yes-:Which ones?7a2.No8.Do you think you would ever like to enroll in a course overtelevision?I.Yes:What kind of subjectinterestwouldyou most?2

60 .No9.Now on another subject, about how m
.No9.Now on another subject, about how many hours would you saythat your television set is playing during the average day?10.Where would you say you get most of your news these days aboutOrange County?From newspaper, radio, television, talking topople.10,._r__.Which?1.Newspaper2.Radio3.Television4.Conversation11-.Now, a couple of questions about your family.What is theoccupation of the head of the household?11Li1.Professional4.Skilled Labor2.Proprietorial/Managerial5.Unskilled Labor3.Sales/Clerical6.Other:lla.How much school has the head of the household completed?1Write rtiitber of years11a)12.What was -.the last grade you attended in school?Wrzite nu,Iter of years12'13.What are the ages of the children in your family?Write age of one child in each box1314.How many working TV sets a-re :in your home?Write nU,,,'_)c,r of sets1415.Do you subscribe to a cable television service?1.Yes2.No1516.Which do you receive most clearly, UHF (Channels 28, 52, 50) orVHF (Channels 2 through 13)?16 _

61 people.Which?10 I1.Newspaper2.3.1'elevL4
people.Which?10 I1.Newspaper2.3.1'elevL4ion4.Conversation11.Now, a couple of questions about your family.What is theoccupation of the head of the household?111.Professional4.Skilled Labor2.Propriotorial/Nanagerial5.Unskilled Labor3.Sales/Clerical6.Other:Ila.How much school has the head of the household completed?',/i3C016'lla....110.1112.What was the last grade you attended in school?Wp:tc12111.1111113.What are the ages of the children in your family?of one chiin each boxLi.4114,How many working TV sets are in your home?n!v;-,bcr of sets14....15.VĀ° you subscribe to a cable television service?1.Yes2.'No1516.Which do you receive most clearly, UHF (Channels 28, 52, 50) orVHF (Channels 2 through 13)?1.UHF (28, 52, 50)2.VHF (2 through 13)3.No difference1617.Finally, we're setting up some discussion groups to talk aboutKOCE, Channel 50's programming.Would you be interested in partici-pating?Those who are selected will be paid $10.00 for their time.1.Yes:Gct aldmos infornationName:Street:Ci

62 ty:Zip:telephone:1-fxpla[nthe :i wil1 bc
ty:Zip:telephone:1-fxpla[nthe :i wil1 bcoe.ntacted if than aria llolct-ed.'17111....01. APPENDIX C Programa Watchedon KOCEKOCE/KCETKOCE/KCETKOCE ONLY(KOCE non-(KOCEKOCE ONLY(KOCE non-Program Titlemgatv)regular)(Regularlregullsi.TotalToI.Children'sprograms.Children'sprograms.1..1Cartoons2-.2Electric Company45-9Little Rascals41-.5Mister Rogers35--eSesame Street24161748Three Stooges1.--1Zoom32--5Total41301-779ILDrama presentationsClassics-1Drama11Masterpiece Theatre52Movies11Henry V/IX3-Plays4-Theater1-Pilm Odessey--Western moviestTotal165Educational/how toprogramAntiquee1Anthropology-ArChitecture1ArtArt Techniques1Aetronomy1Businese!Amines', LawCeramicsConeumer ContestConsumer programsCookingEconomiceEducational prograreElectronicsEnglishPreuth ChefHistoryHittory of Art13621811.414al29334111251922194 KOCE/KCETKr.,.:C/KCETKOCE ONLY(KOCE non-(KOCEKOCE ONLY(KOCE non-.taguktilregularre ular-VIRgE0TotalEducational/how to.protrams(continued)HorticultureHuman BehaviorHYPeractivity1Julia Child

63 s2Kiln is Clay Show-Languages2Law course
s2Kiln is Clay Show-Languages2Law course-MathPsychology9Real Estate-SailingScience2Total43IV.MiscellaneousCorona del Mar FurySpecialsMost programsVan Gogh showReligionMathodiat ChurchDr. MartinBill Alexandertgtal-PlagrealBallet, Ballerinas34--7Boston Pops24--6ConCertS112Country Music11Heifets11Jams program1Musical plays, programsand shows154221OperaI-12Symphony1--1SwanLake-i....1Wiseman Concert-I-.1World Symphony Orchestra-1..1Youth Chorus-2----.2Total2419-447-1---111--1Total447.312WOSOado------"-.--1112122114--1.7-4201WONM1---11NO33319861.-12--3-1-..1213-.I---I KOCE/KCETKOCE/KCETKOCE ONLY(KOCE non-(KOCEKOCE ONLY(KOCE non-reAular)reituka(regular)raggarlTotalV/.Public Relations/Documentaries (includingOrange County)Advocates-1--1Alcoholism1-.1American Family.1.r.1Civic Affairs---11Chinese program---11County Adoption1.-12Documentaries21--3Drug Abuse121.4Forum1---1H.R.D.--1-1Inside Orange County-1..1Interviews.1-1-2Jim Cooper show2-..2Japanese program1---1Meet the press1--.1Mental Healt

64 h-1-.1News Commentary---11Orange Centenn
h-1-.1News Commentary---11Orange Centennial-1-1Orange County Focus165-223Orange County Review-1-1Panel discussions8.-311Power Crisis-1-.1Newport Back Bay1---1So. Americanprogram1--.1Spanish, Mexicanprogress11--2Watergate7--29Washington WeekendReview-1-.1William F. Buckley21--3World Press1--1Total47TO31180VII.Nature /TravelproversEcologyEgypt ExcursionMan of NatureNature programsTravelogues1Total5211311117U. Sports_FootballHorse. RacingTennisTotal APtENDIX D Agriculture 6 BiologicalAgricultureAnatomyArchaeologyBiologyForestryGardeningGeologyNature 6 WildlifeOceanographyPlantsWild AnimalsWild LifeBusinesr SducstionAccountingAdvertisingBookkeepingBusinessBusiness. LewComputer ProgrammingComputer ScienceCourt ReportingFinanceHorne ManagementIncome TaxLibrary ScienceManagementMarketingMerchandisingOffice MachinesOffice WorkReadingReal EstateSalesSecretarial ScienceShorthandSpeed ReadingStocks and BondsTravelTypingTELEVISION COURSE SUBJECTSSciencesConsumer and Health ServicesCake decoratin

65 gConsumer ContestConsumer informationCon
gConsumer ContestConsumer informationConsumer reportsCookingDecoratingDental AssistingHealthHome EconomicsMedicalMedical TermsNursery School EducationNursingNutritionPara MedicalSewingSign LanguageSpeech TherapyTailoringTravel InformationFineALAPSAL12431ArtArts and CraftsDramaFilm MakingFilm TechniquesFlower ArrangingGuitarHistory of ArtHobbiesInterior DecoratingLiberal ArtsMacrameMusicMusic TheoryOperaPersonal GrowthPhotographyPianoPlaysSculptureSingingTheatre ArtsUpholsteryVoodworking Health Sciences & Physical EducationDanceDivingFirst AidModern Jan DancePhysical EducationPistol and Gun HandlingRecreationSportsYogaLiterature and Lan ua esArabicEnglishEnglish GrammarForeign LanguageFrenchGermanJournalismLanguageLiteratureMedia CommunicationReading3hakespeareSpanishSpeechWritingPhysical Science & MathematicsAstronomyBotanyEnvironmental GeographyEnvironmental ScienceGeologyGraphicsMathMetric SystemNev MathPhysical SciencePhysicsScienceSocial ScienceAncient HistoryAnthropologyAstrolog

66 yBible StudyCalifornia State Penal CodeC
yBible StudyCalifornia State Penal CodeChild PsychologyCivicsCivil Penal CodesCollege Credit CoursesCommunication GapCriminologyCurrent LegislationDrivers EducationEconomicsEducationEducation for KidsEducation for older peopleEducational Methods for RetardedChildrenFamily LifeGeographyGovernmentHigh School DiplomaHistoryHistory of Old MoviesOrange County FocusOrange County PrisonsParent EducationParlimentary ProceduresPhilosophyPolice SciencePolitical SciencePre SchoolPsychologyPsychology - Higher levelPublic AffairsPublic RelationsReligionSafety EnvironmentSelfHypnosisSex EducationSocial ProblemsSocial SciencesSociologyTeach ChildrenTeachers AideTeaching Methods to instructthe deafWomen in AmericaWomen'a liberation Technology.ArchitectureAuto RepairAuto ShopAviationElectronicsEngineeringHands -NanIndustrial TechnologyLab TechnicianLocksmith TradeMechanicsRadioRadiologistShopTV RepairTechnologyWeldingGeneral EducationGeneral EducationUNIVERSITY OF CALIF.LOS ANGELESMAY 2-1 1(174CLEARI