/
International Journal of Research and Scientific Innovation IJRSI International Journal of Research and Scientific Innovation IJRSI

International Journal of Research and Scientific Innovation IJRSI - PDF document

morgan
morgan . @morgan
Follow
342 views
Uploaded On 2022-09-08

International Journal of Research and Scientific Innovation IJRSI - PPT Presentation

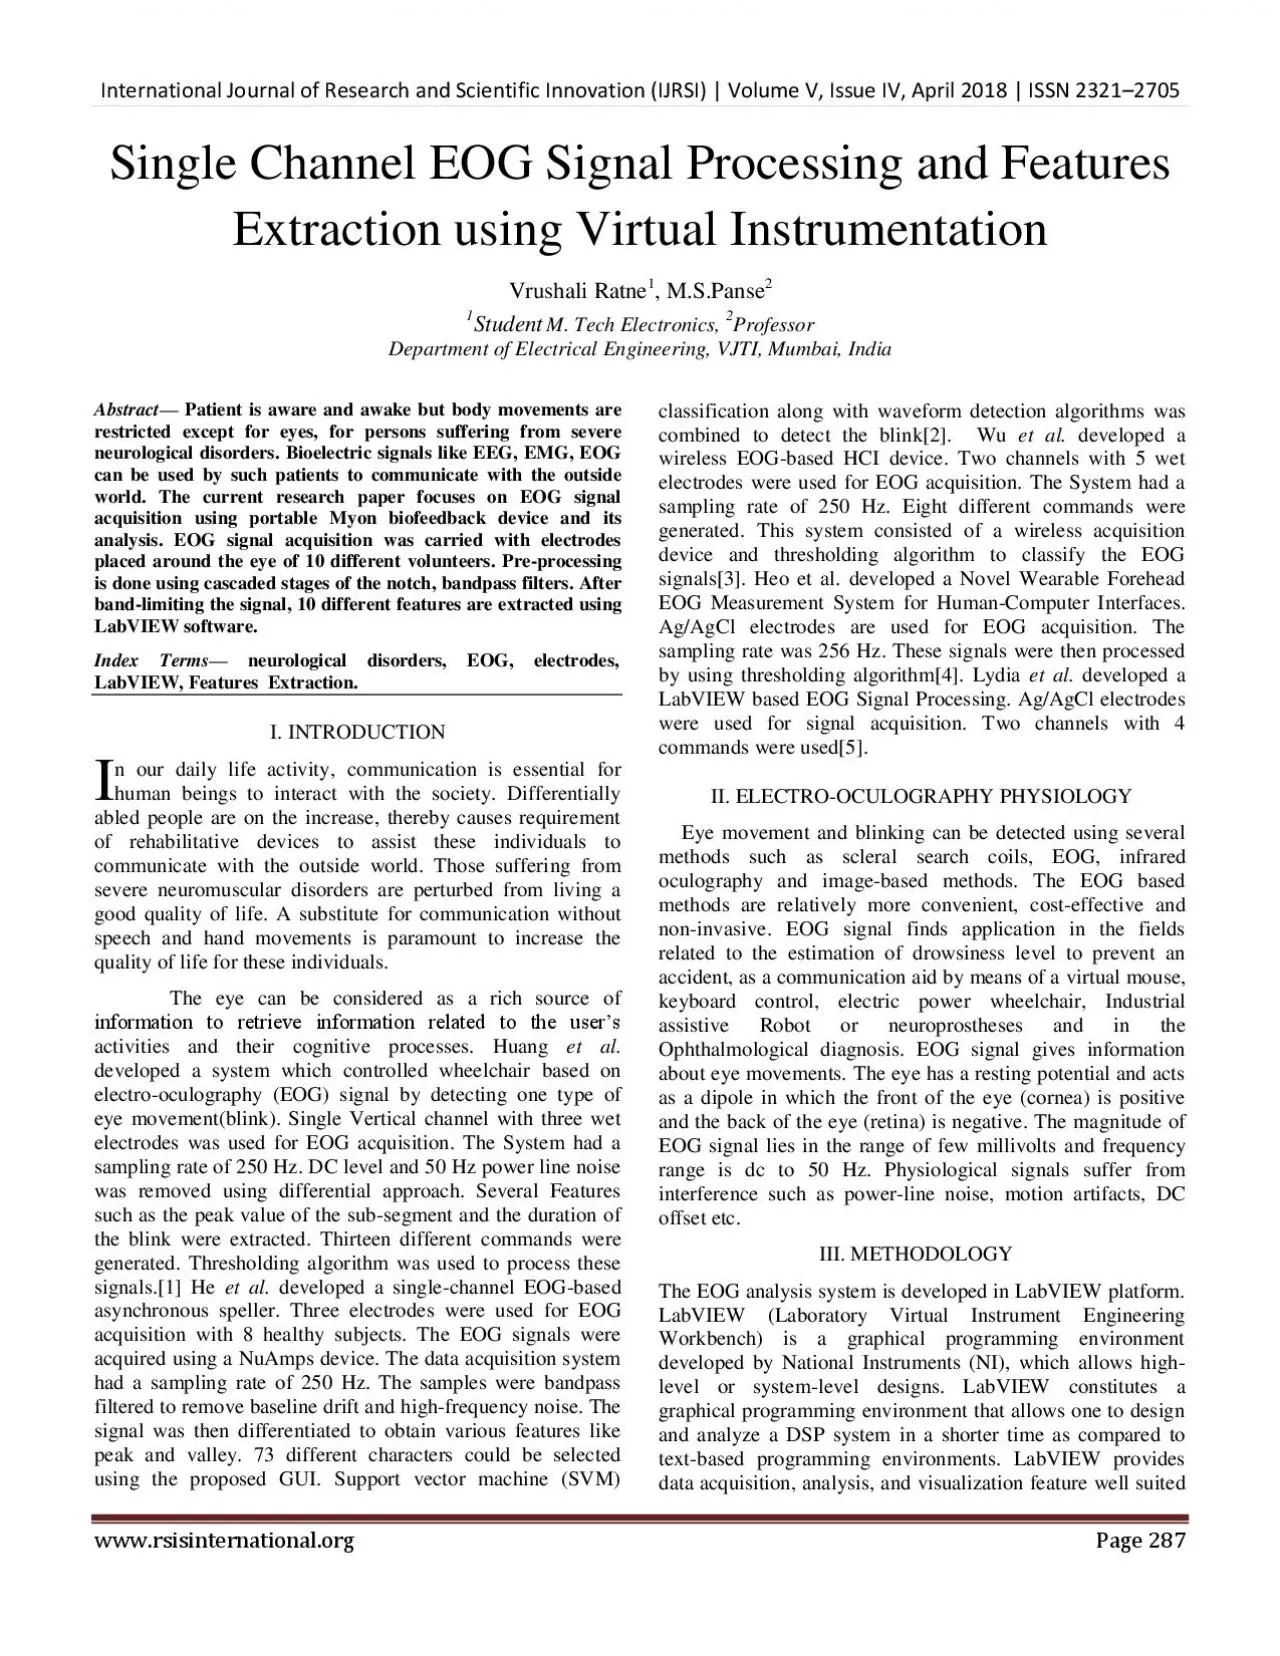
2705 wwwrsisinternationalorg Page 287 Single Channel EOG Signal Processing and Features Extraction using Virtual Instrument ation Vrushali Ratne 1 MS Panse 2 1 Student M Tech Electroni ID: 953332

signal eog eye system eog signal system eye based acquisition ieee labview electrodes peak data signals features international movement

Share:

Link:

Embed:

Download Presentation from below link

Download Pdf The PPT/PDF document "International Journal of Research and Sc..." is the property of its rightful owner. Permission is granted to download and print the materials on this web site for personal, non-commercial use only, and to display it on your personal computer provided you do not modify the materials and that you retain all copyright notices contained in the materials. By downloading content from our website, you accept the terms of this agreement.


Presentation Transcript

International Journal of Research and Scientific Innovation (IJRSI) | Volume V, Issue IV, April 2018 | ISSN 2321 – 2705 www.rsisinternational.org Page 287 Single Channel EOG Signal Processing and Features Extraction using Virtual Instrument ation Vrushali Ratne 1 , M.S. Panse 2 1 Student M. Tech Electronics, 2 Professor Depa rtment of Electrical Engineering, VJTI, Mumbai, India Abstract — Patient is aware and awake but body movements are restricted except for eyes, for persons suffering from severe neurological disorders. Bioelectric signals like EEG, EMG, EOG can be used by such patients to communicate with the outside world. The current r esearch paper focuses on EOG signal acquisition using portable Myon biofeedback device and its analysis. EOG signal acquisition was carried with electrodes placed around the eye of 10 different volunteers. Pre - processing is done using cascaded stages of th e notch, bandpass filters . After band - limiting the signal, 10 different features are extracted using LabVIEW software. In dex Terms — neurological disorders, EOG, electrodes, LabVIEW, Features Extraction . I. INTRODUCTION n our daily life activity, communication is essential for human beings to interact with the society. Differentially abled people are on the increase, thereby causes requirement of rehabilitative devices to assist these individuals to communicate with the outside world. Those sufferi ng from severe neuromuscular disorders are perturbed from living a good quality of life. A substitute for communication without speech and hand movements is paramount to increase the quality of life for these individuals. The eye can be considered as a rich source of information to retrieve information related to the user’s activities and their cognitive processes. Huang et al. developed a sys tem which controlled wheelchair based on electro - oculography ( EOG ) signal by detecting on e type of eye movement(blink). Single Vertical channel with three wet electrodes was used for EOG acquisition. The System had a sampling rate of 250 Hz. DC level and 50 Hz power line noise was removed using differential approach. Several Features such as t he peak value of the sub - segment and the duration of the blink were extracted. Thirteen different commands were generated. Thresholding algorithm was used to process these signals.[1] He et al. developed a single - channel EOG - based asynchronous speller. Thr ee electrodes were used for EOG acquisition with 8 healthy subjects. The EOG signals were acquired using a NuAmps device. The data acquisition system had a sampling rate of 250 Hz. The samples were bandpass filtered to remove baseline drift and high - freque ncy noise. The signal was then differentiated to obtain various features like peak and valley. 73 different characters could be selected using the proposed GUI. Support vector machine (SVM) classification along with waveform detection algorithms was combined to detect the blink[2]. Wu et al. developed a wireless EOG - based HCI device. Two channels with 5 wet electrodes were u

sed for EOG acquisition. The System had a sampling rate of 250 Hz. Eight different commands were generated. This system consist ed of a wireless acquisition device and thresholding algorithm to classify the EOG signals[3]. Heo et al. developed a Novel Wearable Forehead EOG Measurement System for Human - Computer Interfaces. Ag/AgCl electrodes are used for EOG acquisition. The samplin g rate was 256 Hz. These signals were then processed by using thresholding algorithm[4]. Lydia et al. developed a LabVIEW based EOG Signal Processing . Ag/AgCl electrodes were used for signal acquisitio n. Two channels with 4 c ommands were used [5]. II. ELECTRO - OCULOGRAPHY PHYSIOLOGY Eye movement and blinking can be detected using several methods such as scleral search coils, EOG, infrared oculography and image - based methods. The EOG based methods are relatively more convenient, cost - effective and non - inv asive . EOG signal finds application in the fields related to the estimation of drowsiness level to prevent an accident , as a communication aid by means of a virtual mouse, keyboard control, electric power wheelchair , Industrial assistive Robot or neuropros theses and in the Ophthalmological diagnosis. EOG signal gives information about eye movements. The eye has a resting potential and acts as a dipole in which the front of the eye (cornea) is positive and the back of the eye (retina) is negative. The magnit ude of EOG signal lies in the range of few millivolts and frequency range is dc to 50 Hz. Physiological signals suffer from interference such as power - line noise, motion artifacts, DC offset etc. III. METHODOLOGY The EOG analysis system is developed in LabVIEW platform. LabVIEW (Laboratory Virtual Instrument Engineering Workbench) is a graphical programming environment developed by National Instruments (NI), which allows high - level or system - level designs. LabVIEW constitutes a graphical programming environment that allows one to design and analyze a DSP system in a shorter time as compared to text - based programming environments. LabVIEW provides data acquisition, analysis , and visualization feature well suited I International Journal of Research and Scientific Innovation (IJRSI) | Volume V, Issue IV, April 2018 | ISSN 2321 – 2705 www.rsisinternational.org Page 288 for DSP system - level design[16]. The biomedical signals acquired from the human body are frequently very small, often in the millivolt range, and each has its own processing needs[11 ]. LabVIEW provides Digital filter design toolkits which can be configured for any design as per the requirement. A. Implemented Block Schematic Fig. 1. Block Schematic of the EOG System The implemented system consists of stages of Data acquisition , Signal Conditioning and Features Extraction as shown above . B. Data Acquisition Recordings of all EOG signals were carried out using a Myon biofeedback device. Disposable pre - gelled Ag/AgCl electrodes were used for EOG si g nal acquisition. The sampling f requency of the device is 2000Hz. Figure 1 shows placement of electro

des. Data is collected from 5 Volunteers for about 60 seconds for a given set of commands. Those commands are: Up, Down, Blink Once, Up, Down, Blink Twice etc. A pair of electrodes was placed above and below the right Eye(anyone eye can be deployed). C. Signal Conditioning Acquired EOG signal was then passed through cascaded stages of filters. EOG signal is of low frequency. To remove 50Hz power - line noise, the signal is initially passed through the notch filter. Further, the signal is band - limited fro m 0.5 - 35H z. Baseline wandering is removed by passing the signal through differentiator as shown in block schematic. D. Features Extraction After filtering, Feature extraction is undertaken to acquire the most significant information from the original data in - order to easily classify the eye movements . TABLE I EXTRACTED FEATURES Mean Peak Amplitude Median Peak Location Kurtosis Number of Peaks Skewness Sample Entropy Standard Deviation Variance Fig. 2.Electrode Placement IV. RESULTS Block schematic has clearly indicated labels as ( A ) , ( B ) , ( C ) , ( D ) which is the output of the respective blocks. ( A) ( B) International Journal of Research and Scientific Innovation (IJRSI) | Volume V, Issue IV, April 2018 | ISSN 2321 – 2705 www.rsisinternational.org Page 289 ( C) ( D) ( E) ( F) ( G) Upward or Downward movement of an eye corresponds to Vertical Movement. As seen from the result (F), Up Movement initially has as a positive peak, which is then accompanied by a negative peak. The amplitude of initial positive peak is higher than that of the negative peak. For the downward movement, the case is exactly the opposite. If the subject l ooks straight then dc level appears. Blink EOG signal is also attainable from vertical channel. Blink signal in comparison with up movement has the highest peak but time span is short which makes them distinguishable. Result(E) shows that maximum informati on content is present at lower frequencies. V. CONCLUSIONS The EOG Data is acquired using electrodes through Myon Biofeedback device. This collected data is signal conditioned in LabVIEW using Bandpass Filter, Notch filter , and Differentiator. The Features extractions are carried out on filtered data which will be useful for classification of signals as an extended work. REFERENCES [1] Huang Qiyun, Shenghong He, Qihong Wang, Zhenghui Gu, Nengneng Peng, Kai Li, Yuandong Zhang, Ming Shao, and Yuanqing Li, “An EOG - Based Human - Machine Int erface for Wheelchair Control”, IEEE Transactions on Biomedical Engineering vol. pp., no. 99, pp. 1 - 1, July 2017. [2] He Shenghong and Yuanqing Li, “A Single - channel EOG - based Speller”, IEEE Transactions on Neural Systems and Rehabilitation Engineering vol. PP, no.99, pp. 1 - 1, June 2017. [3] Wu, Shang - Lin, Lun - De Liao, Shao - Wei Lu, Wei - Ling Jiang, Shi - An Chen, and Chin - Teng Lin, “Controlling a human – computer interface system with a novel cla ssification method that uses electrooculography signals”,

IEEE Transactions on Biomedical Engineering 60, no.8, pp.2133 - 2141, February 2013. [4] Heo, Jeong, Heenam Yoon, and Kwang Suk Park, “A Novel Wearable Forehead EOG Measurement System for Human - Computer I nterfaces”, Sensors vol.17, no. 7, pp. 1485, July 2017 [5] Lydia Yuhlung, Hemashree Bordoloi, Khomdram Jolson Singh, Irengbam Vengkat Mangangcha and Laishram Richard, “LabVIEW Based EOG Signal Processing”, International Journal for Research in Emerging Scienc e & Technology , vol. 2, no. 3, March 2015. [6] Champaty B, Nayak SK, Pal K, Thirugnanam A, “Development of an EOG based computer aided communication support system”, Annual IEEE India Conference (INDICON), New Delhi, India, 2015. [7] Andreas Bullingy , Jamie A. Ward z , Hans Gellersenz and Gerhard Trostery ., “Eye Movement Analysis for Activity Recognition using Electrooculography” , IEEE Transactions on Pattern Analysis And Machine Intelligence , vol. 33, no. 4, April 2011. [8] Lopez, Alberto, F. J. Ferrero, Marta Valledor, Juan C. Campo, and Octavian Postolache., “A study on electrode placement in EOG systems for medical applications”, In Medical Measurements and Applications (MeMeA), 2016 IEEE International Symposium on , pp. 1 - 5. IEEE, 2016. [9] R. Barea, L. Bosquete, M. Mazo, and E. Lopez, “System for assisted mobility using eye movements based on electrooculography ”, IEEE Transactions on Rehab. Eng ., vol. 10, no. 4, pp. 209 - 217, 2002. [10] Patterson Casmir D’Mello, Sandra D’Souza, “Design and development of a Virtual Instrument for Bio - signal Acquisition and Processing using LabVIEW”, International Journal of Advanced Research in Electrical, Electronics and Instrumentation Engineering , IJAREEIE, Vol. 1, Iss .1, July 2012. International Journal of Research and Scientific Innovation (IJRSI) | Volume V, Issue IV, April 2018 | ISSN 2321 – 2705 www.rsisinternational.org Page 290 [11] Umashankar and Dr. M. S. Panse, “Electroretinogram (ERG) Signal Processing & Analysis in LabVIEW”, Advances in Medical Informatics Volume I, Issue I, pp - 01 - 05, 2011. [12] Champaty , Biswajeet, Jobin Jose, Kunal Pal, Thirugnanam A, “Development of eog based human machine interface control system for motorized wheelchair”, Emerging Research Areas: Magnetics, Machines Drives (AICERA/ iCMMD ), 2014 Annual International Conference on. IEEE, 2014. [13] A. Bulling , D. Roggen, and G. Troster, “What’s in the Eyes for Context - Awareness?” IEEE Pervasive Computing, 2010, doi :10.1109/MPRV.2010.49. [14] “Spinal Cord Injury Facts & Figures at a Glance.” National Spinal Cord Injury Statistical Center. 2008. University of Alabama 3 April 2010. [15] Sharma, Divya, and Rashpinder Kau r. “Design and Analysis of IIR Notch Filter using LabVIEW.” Computational Intelligence & Communication Technology (CICT), 2015 IEEE International Conference on . IEEE, 2015. [16] https://www.ni.com [17] http://censusindia.gov.in/Census_And_You/disabled_population.as px [18] https://www.nibib.nih.gov/science - educati on/science - topics/rehabilitation - engineering