/
Cryogenic thermometry for refrigerant distribution system of JT-60SA Cryogenic thermometry for refrigerant distribution system of JT-60SA

Cryogenic thermometry for refrigerant distribution system of JT-60SA - PowerPoint Presentation

mrsimon
mrsimon . @mrsimon
Follow
342 views
Uploaded On 2020-08-03

Cryogenic thermometry for refrigerant distribution system of JT-60SA - PPT Presentation

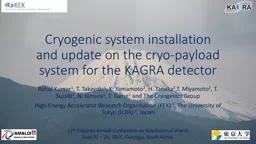
Kyohei NATSUME Haruyuki MURAKAMI Kaname KIZU Kiyoshi YOSHIDA Yoshihiko KOIDE Japan Atomic Energy Agency JAEA Tucson Arizona 30th June Cryogenic Engineering Conference 2015 1 A Tokamak u ID: 796824

sensor method engineering cryogenic method sensor cryogenic engineering conference 30th arizona tucson 2015 stycast june temperature saddle field wire

Share:

Link:

Embed:

Download Presentation from below link

Download The PPT/PDF document "Cryogenic thermometry for refrigerant di..." is the property of its rightful owner. Permission is granted to download and print the materials on this web site for personal, non-commercial use only, and to display it on your personal computer provided you do not modify the materials and that you retain all copyright notices contained in the materials. By downloading content from our website, you accept the terms of this agreement.


Presentation Transcript

Slide1

Cryogenic thermometry for refrigerant distribution system of JT-60SA

Kyohei NATSUME, Haruyuki MURAKAMI, Kaname KIZU, Kiyoshi YOSHIDA, Yoshihiko KOIDEJapan Atomic Energy Agency (JAEA)

Tucson, Arizona, 30th June

Cryogenic Engineering Conference 2015

1

Slide2

A Tokamak under

construction in JapanJT-60SA

is a fusion experiment designed to support the operation of ITER and to investigate how best to optimize the operation of fusion power plants that are built after ITER. It is a joint international research and development project involving Japan and Europe, and is to be built in Naka, Japan using infrastructure of the existing JT-60 Upgrade experiment. SA stands for "super, advanced", since the experiment will have superconducting coils and study advanced modes of plasma operation

.

(http://www.jt60sa.org/)

Tucson, Arizona, 30th June

Cryogenic Engineering Conference 2015

2

Slide3

Superconducting Coils

Magnetic field for confinement plasma is generated by 18 Toroidal Field Coil (TFC),

6 Equilibrium Field Coil (EFC) and Central Solenoid (CS).

Tucson, Arizona, 30th June

Cryogenic Engineering Conference 2015

3

Specification

JT-60SA

Magnetic Energy of TFC

(GJ)

1.1

Maximum Magnetic Field of TFC

(T)

5.65

Centripetal Force

of TFC (MN)

22.6

Magnetic Field of CS

(T)

8.9

Cold Mass

(ton)

~ 700

Slide4

Refrigerant distribution system

Tucson, Arizona, 30th JuneCryogenic Engineering Conference 2015

4

Helium

from a Refrigerator System is distributed to Toroidal Field Coil (TFC), Poloidal Field Coil (PFC)*, Thermal Shield (TS), High Temperature Superconducting Current Lead (HTSCL) and CryoPump. (*PFC are composed of Equilibrium Field Coil and Central Solenoid)

Cold Component

TFC

PFC

TS

HTSCL

CryoPump

Temperature

(K)

4.4

4.4

80

50

3.7

Pressure

(MPa)

0.40

0.40

1.35

0.40

0.5

Flow rate

(g/s)

876

960

404

30

270

Pressure loss


(MPa)

0.13

0.08

0.13

0.30

0.1

Heat load


(W)

1794

1850

42,000

-

1400

Mass


(Ton)

370

206

96

-

-

Slide5

Temperature Measurement

About 300 thermometers are attached on distribution pipes and thermal shield (TS). They are mainly installed on pipes beside flow meters in Valve boxes (VBs) and Coil Terminal Boxes (CTBs) in order to adjust flow rate of refrigerant to cold components.

Tucson, Arizona, 30th June

Cryogenic Engineering Conference 2015

5

Coil Terminal Box (CTB)

External gathered pipe

Cryopump valve unit

Transfer Line

Valve box (VB)

In-Cryostat Piping

Slide6

How to install on refrigerant pipe?

Well MethodHigher accuracy*Lower productivity

Leak tightness and proof pressure test are imposed.Saddle Method

Lower accuracy*Higher productivitySpecific inspection is not imposed.

*Main factor

(“Cooling power from sensor” – “Heat load to sensor”)

Tucson, Arizona, 30th June

Cryogenic Engineering Conference 2015

6

Saddle

Slide7

Reference

:A thermometry for LHC at CERN

Dimention:100×10×2 (mm)

Temperature ̴1.8 KWhen the temperature of the terminal of

Microstrip L

ine is 80 K, the accuracy is ±100 mK.

The similar method will be adopted for ITER*.

“Industrial-type cryogenic thermometer with built-in heat interception”, C

.

Balle

and J.

Casas

: Advances in Cryogenic Engineering 41 (1996) pp1715-1721.

Tucson, Arizona, 30th June

Cryogenic Engineering Conference 2015

7

Slide8

Requirement accuracy

JT-60SA comply with ITER requirement*

Temperature

Precision

T at

4.2 K : used in magnet coil temperature control loops±0.1

K

T

˂

10 K

±0.2

K

10 K

˂

T ˂ 80 K

±0.3 K80 K ˂ T

±0.5 K

*DDD11-9: Instrumentation and controlsDDD: Design Description DocumentTucson, Arizona, 30th June

Cryogenic Engineering Conference 20158

: The temperature acquisition period per thermometer should be less than 2 seconds.

Slide9

Objective

To decide the thermometry method for Helium in pipes.comparing two sensor attachment methods: Well method and Saddle method

comparing two sensors: CernoxTM and TVO

comparing two wire anchoring methods: Print-Circuit Board (PCB) and CuNi wire with Stycast 2850FT

comparing two sensor fixation materials: Apiezon N grease and Stycast 2850FTin terms of accuracy and productivity.

If the accuracies of both choices are satisfied the requirement,higher productivity one is adopted.

Tucson, Arizona, 30th June

Cryogenic Engineering Conference 2015

9

Sensor attachment

Sensors

Wire anchoring method

Sensor

fixation material

Well method

Cernox

Print

-Circuit Board (PCB)Apiezon N greaseSaddle method

TVOCuNi wire with Stycast

Stycast 2850FT

Slide10

Experimental apparatus

The sample pipe is installed in vacuum and filled with liquid Helium (LHe). The temperature of LHe is shifted by pressurized or depressurized.

A temperature sensor is directly immersed in LHe in the pipe as the reference sensor. The sensor accuracies attached on the pipe are evaluated using this reference sensor.

Tucson, Arizona, 30th June

Cryogenic Engineering Conference 2015

10

LHe reservoir

Sample pipe

Return pipe

Vacuum

Liquid He

Liquid N

2

Baffles

Top flange

Cryostat

Sensors

~1600 mm

Slide11

1. Two attachment methods tested at the same time using Cernox anchoring with PCB

Tucson, Arizona, 30th June

Cryogenic Engineering Conference 2015

11

Thermal anchor

(Copper block and PCB*)

*PCB: Printed-Circuit Board

Sensor h

older

(Saddle method)

20 mm

Outer diameter: 34 mm

Stainless steel pipe

Sensor h

older

(Well method)

15 mm

Slide12

Comparison of the well and the saddle methods

at 3.37-4.22 KBoth differences from the reference sensor are allowable

Tucson, Arizona, 30th June

Cryogenic Engineering Conference 2015

12

*The calibrated accuracy of the bare chip of Cernox

TM

is ±5 mK

(

Temperature Measurement and Control Catalog

, Lake Shore

Cryotronics

, Inc.)

Slide13

Comparison of the well and the saddle methods

at 4.22-5.06 KBoth differences from the reference sensor are allowable

Tucson, Arizona, 30th June

Cryogenic Engineering Conference 2015

13

*The calibrated accuracy of the bare chip of Cernox

TM

is ±5 mK

(

Temperature Measurement and Control Catalog

, Lake Shore

Cryotronics

, Inc.)

Slide14

2. Cernox and TVO immersed in Liquid He tested

3. The saddle method TVO anchoring CuNi wires with Stycast 2850FT

tested

Tucson, Arizona, 30th June

Cryogenic Engineering Conference 2015

14

Thermal

anchor: 5 turns

(

CuNi wires

with

Stycast

2850FT

)

Sensor holder

(Saddle method)Outer diameter: 34 mmStainless steel pipe

15 mm

Slide15

Comparison of Cernox and TVO

at

3.40-4.73

K

Any differences between two sensors are less than 30 mK

Tucson, Arizona, 30th June

Cryogenic Engineering Conference 2015

15

Slide16

4. Thermal Cycle test of a sensor fixed with Stycast

Tucson, Arizona, 30th JuneCryogenic Engineering Conference 2015

16

TVO is attached on the copper holder with Stycast 2850 FT instead of being inserted in a hole with Apiezon N grease

TVO with Stycast on copper block

The displayed temperature increase after the sensor is fixed with the Stycast and cooled down by LN2.

Degradation of sensor is caused by the thermal contraction of the Stycast.

Slide17

Summary of experimental results

The differences of measured value between attached thermometers and directly immersed one at 3.34-5.06 K are:Well Method

∼15 mKSaddle Method ∼35 mKThe difference of measured value between Cernox and TVO at 3.40-4.73 K

is: ∼25 mK

The thermal anchoring of measurement wire made of CuNi with Stycast 2850FT is applicable.The fixing TVO with Stycast 2850FT is not applicable because of the degradation by the thermal contract.

Tucson, Arizona, 30th June

Cryogenic Engineering Conference 2015

17

Slide18

Conclusion

TVO sensors will be used for the thermometry of almost all refrigerant distribution lines of JT-60SA. The saddle method, CuNi wire with Stycast, and Apiezon N grease will be adopted as sensor attachment method, wire anchoring method, and sensor fixation material, respectively.

Cernox sensors attached by the well method are used for the lines beside Poloidal Field Coils because the temperature should be measured more precisely there (∼20 measurement points).

Tucson, Arizona, 30th June

Cryogenic Engineering Conference 2015

18

Sensor attachment

Sensors

Wire anchoring method

Sensor

fixation material

Well method

Cernox

Print

-Circuit Board (PCB)

Apiezon N grease

✓Saddle method

✓TVO✓

CuNi wire with Stycast

Stycast 2850FT