/
15.1 The Oceans Who has been to an ocean? 15.1 The Oceans Who has been to an ocean?

15.1 The Oceans Who has been to an ocean? - PowerPoint Presentation

myesha-ticknor
myesha-ticknor . @myesha-ticknor
Follow
361 views
Uploaded On 2018-03-16

15.1 The Oceans Who has been to an ocean? - PPT Presentation

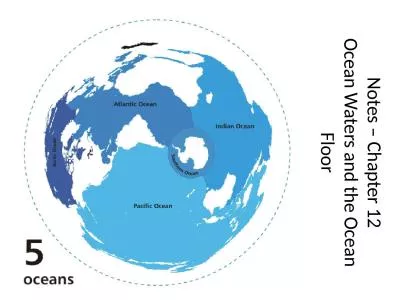
How do we study them Have they always been here Oceanography The scientific study of earths oceans Ocean currents Chemical composition Seafloor sediments amp topography Marine life How ID: 653572

ocean water tides wave water ocean wave tides oceans currents surface salinity waves cold layers salt depth earth

Share:

Link:

Embed:

Download Presentation from below link

Download Presentation The PPT/PDF document "15.1 The Oceans Who has been to an ocean..." is the property of its rightful owner. Permission is granted to download and print the materials on this web site for personal, non-commercial use only, and to display it on your personal computer provided you do not modify the materials and that you retain all copyright notices contained in the materials. By downloading content from our website, you accept the terms of this agreement.


Presentation Transcript

Slide1

15.1 The OceansSlide2

Who has been to an ocean?

How do we study them?

Have they always been here?Slide3

Oceanography

The scientific study of earth’s oceans

Ocean currents

Chemical composition

Seafloor sediments & topography

Marine life

How?Slide4

Technology

Ocean floor topography

Sonar: a boat emits a sound that bounces off the ocean floor. The boat records the time it takes and calculates the distance.

Side-scan sonar: sound waves leave the boat at an angle so underwater hills can be mapped.Slide5

Technology

Satellites: monitor ocean properties from space

Ocean surface temps

Ocean currents

Wave conditions

Crazy Slide6

Have the oceans always been here?

Imagine a world without oceans.

Have they always been here? How did they form?Slide7

Ocean history

Earth is about 4.6 billion years old

Geologic clues indicate that oceans have existed most of that time.

Sediments deposited in water

Lava that cooled underwater Slide8

Where did the water come from?

2 hypothesized sources of water

Comet

impacts

Water was released when meteors hit the ground

Possibly enough to fill ocean basins over

time

Meteorite impacts

Contain up to 0.5% water

Would have been more than sufficient to fill oceans

Slide9

Water release

Volcanism

When volcanoes erupt they release carbon dioxide and water vapor

Eruptions early in earth’s history slowly moved water from inside the earth into the atmosphere

When temps cooled the water vapor

condensed

into the oceansSlide10

Blue Planet

71% of earth’s surface is covered by oceans

Our bodies are about 70% water. Coincidence?

97% of earth’s water is saltwater

Average depth of the oceans is 3800 m (2.4 miles).Slide11

Oceans

Pacific: largest ocean, larger than all landmasses combined

Atlantic

Indian

Artic

AntarcticSlide12

Seas

Seas: saltwater bodies that are smaller than oceans and mostly landlocked.

Examples?Slide13

In sum…

Oceanography: study of oceans. Uses technology

2 hypothesized sources of the earth’s water

Blue Planet: oceans and water distributionSlide14

15.2 Seawater

Ever swam in an ocean? Accidentally taste the water?

96.5% water and 3.5% dissolved salts

Mostly

NaClSlide15

Salinity

Salinity: the amount of dissolved salts in seawater

Overall, the average salinity of the oceans is 3.5% (35

ppt

)

But salinity can actually vary from place to placeSlide16

Salinity variation

Salinity is higher where evaporation exceeds precipitation. Why?

Salinity is lower in places where freshwater is added. Examples?

Where is the world’s

saltiest water?Slide17

Salt Cycle

Sources of sea salt:

Volcanic gases contain chlorine and sulfur dioxide. These gases dissolve in water and form ions

Weathering of rocks on earth’s surface (sodium, calcium, potassium, iron). These ions are flushed into the ocean by riversSlide18

Salt Cycle

Overall salinity is always at 3.5%. Therefore, salts are always being removed at about the same rate they are being added. It is balanced.Slide19

Salt Cycle

Removal of salts: salt precipitation, salt spray, marine animals use them to form shellsSlide20

Physical properties of seawater

Density: ions in seawater increase the density

Freshwater: 1.00 g/cm

3

Seawater: 1.02-1.03 g/cm

3

What effect does this have?Slide21

Physical properties…

Light absorption:

Water absorbs light

Light penetrates only the upper 100m of seawater

Below that depth it is dark and there’s not enough light for photosynthesis

What does this mean for sea life?Slide22

Ocean Layering

Surface temperatures: average 15 Celsius. Warmer or colder at the poles?

Water temp decreases significantly with depth.

Deep ocean water is always cold, even in the tropics.Slide23

Ocean layering

Temperature Profile: water temp vs. depthSlide24

Ocean layers

Surface layer: top, sunlit layer of ocean water. About 100m thickSlide25

Ocean layers

Thermocline: transition layer. Temp decreases rapidly with depth.Slide26

Ocean Layers

Bottom Layer: cold, dark, uniform temps near freezing.Slide27

Layers

Surface and thermocline layers are absent at the poles where water is cold everywhere.

What causes ocean layering? How is cold water different than warm water?Slide28

Water Masses

Deep water is colder, saltier and therefore more dense. It sinks and doesn’t mix with other layers.

This water migrates slowly toward the equator as one mass.

Where is the densest water in the world?Slide29

In sum…

Salinity averages 3.5% but can vary between locations

Sources & removal of salt

Ocean layers based on density & temp

Water massesSlide30

15.3 Ocean Movements

Oceans are always in motion

Waves

Tides

Currents

upwellingSlide31

Waves

Wave: rhythmic movement that carries energy through space or matter (ocean water)

We all know what a water wave looks like. How does it work?Slide32

Waves

Caused by wind blowing on the ocean surface

Water molecule moves in a circle while the energy moves forward.

Observe an animation of wave motion.Slide33

Wave characteristics

Crest: highest point of the wave

Trough: lowest point of the wave

Wavelength: length between crests

Wave height: vertical distance from crest to troughSlide34

Wave characteristics

Wavelength determines depth of water disturbance: depth = 1/2 wavelength

Wave speed increases with wavelengthSlide35

Wave height

3 factors:

Wind speed

Wind duration

Fetch – expanse of water the wind blows across

More = larger waves (think hurricanes)Slide36

Breaking waves

Waves spilling over, like when they hit a shore. Called breakers.

1. wave approaches the shore, water is more shallow

2. friction with bottom slows the wave

3. waves from behind catch up, decreasing wavelength. This increases wave height.

4. wave is too tall and spills over.Slide37

Breaking wavesSlide38

Tides

Tides: periodic rise and fall of sea level

High tide & low tide

Any experience with this?Slide39

Tides

Tidal range: difference between water levels of high and low tide

Tidal range can change based on topography and latitude

Bay of Fundy near

Novia

Scotia has the greatest tidal range, about 15mSlide40
Slide41

Tides

Generally, a daily cycle of high and low tides takes 24hrs and 50min

What causes tides?Slide42

Cause of Tides

The moon

NOVA | What Causes the Tides?Slide43

Cause of tides

The sun also plays a role

Spring tides: larger tidal ranges that occur when the sun and moon align.

Neap tides: lower tidal ranges that occur when the sun and moon’s gravitational forces are acting against one anotherSlide44

Cause of tidesSlide45

Tides

Are a result of gravitational interactions between the earth, moon, and sun.Slide46

Ocean currents

Remember water masses?

The movement of water masses is an example of an ocean current.

Density current: ocean current that is caused by differences in temp and salinity.

Density currents move slowly in deep ocean waters.Slide47

currents

Surface currents: currents near the surface that are caused by wind.

Can move as fast as 100km/day! Think about getting caught in that current.

Follow global wind patterns.Slide48

Gyres

Winds and landmasses cause ocean currents to form closed loops called gyres.

Clockwise loops in the N. hemisphere. Counterclockwise in the S. hemisphere. Why?Slide49

Gyres

Gyres are one way the earth looks to balance heat distribution.

Warm water flows toward the poles, where it cools, and then moves back toward the equator.

Cold water moves slowly. Slide50

How do you think the currents can affect weather?Slide51

Upwelling

Currents flow horizontally

Upwelling is the upward (vertical) motion of water.

Occur on the western coasts of continents where surface currents pull surface waters to the west.

Cold, nutrient rich water replaces the surface water.Slide52

Upwelling

Cold water is nutrient rich which is good for marine life. Some of the world’s best fishing areas are of the coasts of Peru and California.Slide53

In sum..

Wave characteristics and motion

Tides and their causes.

Currents – surface and density

Upwelling