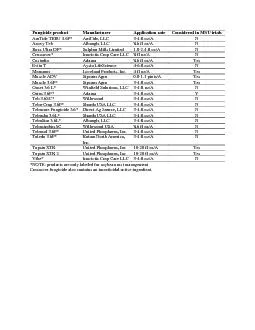
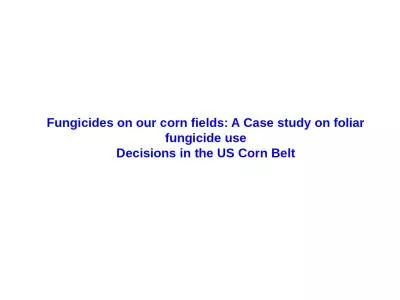
/
2013 Foliar Fungicide Product & Timing Comparison on Corn 2013 Foliar Fungicide Product & Timing Comparison on Corn

2013 Foliar Fungicide Product & Timing Comparison on Corn - PowerPoint Presentation

myesha-ticknor
myesha-ticknor . @myesha-ticknor
Follow
353 views
Uploaded On 2018-09-30

2013 Foliar Fungicide Product & Timing Comparison on Corn - PPT Presentation

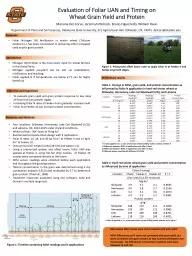
South Central Agriculture Laboratory Clay Center NE Tamra JacksonZiems Extension Plant Pathologist University of Nebraska Lincoln Although at very low severity gray leaf spot was the predominant foliar disease during the growing season at this location ID: 683161

stratego yld amp fungicide yld stratego fungicide amp v11 july june treatment 2013 foliar trial comparison timing added nis

Share:

Link:

Embed:

Download Presentation from below link

Download Presentation The PPT/PDF document "2013 Foliar Fungicide Product & Timi..." is the property of its rightful owner. Permission is granted to download and print the materials on this web site for personal, non-commercial use only, and to display it on your personal computer provided you do not modify the materials and that you retain all copyright notices contained in the materials. By downloading content from our website, you accept the terms of this agreement.


Presentation Transcript

Slide1

2013 Foliar Fungicide Product & Timing Comparison on Corn

South Central Agriculture Laboratory

Clay Center, NE

Tamra Jackson-Ziems

Extension Plant Pathologist

University of Nebraska - LincolnSlide2

Although at very low severity, gray

leaf spot was the predominant foliar disease during the growing season at this location.

Gray leaf spot severity level

was < 1% for all treatments. 2013 DiseasesSlide3

Common rust was the foliar disease first observed in this trial & was initially seen in mid-July. Disease severity was very low at this location and did not exceed trace amounts (

0.1%) for any treatment.

2013 DiseasesSlide4

Southern rust was present and was first identified in this trial on September

4th

. This disease was observed in trace amounts (0.1%) for all treatments.

2013 DiseasesSlide5

Eyespot, common smut, and

Physoderma brown spot were observed sparsely in this trial, thus not justifying ratings for these diseases at this location in 2013.

2013

DiseasesSlide6

On August 1

st, a storm event with strong wind and hail occurred when the corn was at the end of the R1 growth stage which caused an estimated 35% defoliation. Foliar fungicide treatments were applied prior to the event on June 13

th, June 26

th, July 11th, and July 26th. 2013 Hail DamageSlide7

2013 Foliar Fungicide Trials

South Central

Agriculture Laboratory

Clay

Center, NE

Last year’s crop was corn

Planting

date: 5/15/13Target plant population of 31,763 plants/A

Corn hybrid:

NK N68B

(GLS rating

7/9

,

”fair”, not rated for CR,

& SR rating

2/9

,

“excellent”)

Nine foliar fungicide treatments and a non-treated control replicated six times

NIS added at 0.25% v/v

High clearance sprayer used at 20

gpa

at 40 psi

Alley width & row spacing = 30 inches

Overhead sprinkler irrigated

2005-2006Slide8

2013 Fungicide Product & Timing Comparison Trial in NE

Gray leaf spot disease severity (%)

Rating Date & Growth Stage

Foliar fungicide applications were made June 13 (V4), June 26 (V7), July 11 (V11), and July 25

th

(R1).NIS added to each fungicide treatment at 0.25% v/v.

Treatment & application rateSlide9

2013 Fungicide Product & Timing Comparison Trial in NE

Area Under the Disease Progress Curve (AUDPC) for gray leaf spot

Treatment & application rate

Non-treated control

Headline AMP R1, 10 fl oz/A

Aproach

R1, 6 fl oz/A

Stratego YLD V11, 4 fl oz/A

Priaxor

R1, 4 fl oz/A

bc

Stratego YLD V7, 2 fl oz/A

Stratego YLD V4, 4 fl oz/A

Stratego YLD V4, 2 fl oz/A

Stratego YLD V7, 4 fl oz/A

Stratego YLD R1, 4 fl oz/A

bc

ab

bc

b

c

c

a

c

c

c

Foliar fungicide applications were made June 13 (V4), June 26 (V7), July 11 (V11), and July 25

th

(R1).

NIS added to each fungicide treatment at 0.25% v/v. Treatments with different letters are

statistically different. Coefficient of variation is 15.9%.

UTC

V4

V7

V11

R1Slide10

2013 Fungicide Product & Timing Comparison Trial in NE

Common rust disease severity (%)

Rating Date & Growth Stage

Treatment & application rate

Foliar fungicide applications were made June 13 (V4), June 26 (V7), July 11 (V11), and July 25

th

(R1).

NIS added to each fungicide treatment at 0.25% v/v.Slide11

2013 Fungicide Product & Timing Comparison Trial in NE

Area Under the Disease Progress Curve (AUDPC) for common rust

Treatment & application rate

Non-treated control

Headline AMP R1, 10 fl oz/A

Aproach

R1, 6 fl oz/A

Stratego YLD V11, 4 fl oz/A

Priaxor

R1, 4 fl oz/A

Stratego YLD V7, 2 fl oz/A

Stratego YLD V4, 4 fl oz/A

Stratego YLD V4, 2 fl oz/A

Stratego YLD V7, 4 fl oz/A

Stratego YLD R1, 4 fl oz/A

Foliar fungicide applications were made June 13 (V4), June 26 (V7), July 11 (V11), and July 25

th

(R1).

NIS added to each fungicide treatment at 0.25% v/v

.

No statistical differences among treatments.

Coefficient

of variation is 0

%.

UTC

V4

V7

V11

R1Slide12

2013 Fungicide Product & Timing Comparison Trial in NE

Southern rust disease severity (%)

Rating Date & Growth Stage

Treatment & application rate

Foliar fungicide applications were made June 13 (V4), June 26 (V7), July 11 (V11), and July 25

th

(R1).

NIS added to each fungicide treatment at 0.25% v/v.Slide13

2013 Fungicide Product & Timing Comparison Trial in NE

Area Under the Disease Progress Curve (AUDPC) for southern rust

Treatment & application rate

Non-treated control

Headline AMP R1, 10 fl oz/A

Aproach

R1, 6 fl oz/A

Stratego YLD V11, 4 fl oz/A

Priaxor

R1, 4 fl oz/A

Stratego YLD V7, 2 fl oz/A

Stratego YLD V4, 4 fl oz/A

Stratego YLD V4, 2 fl oz/A

Stratego YLD V7, 4 fl oz/A

Stratego YLD R1, 4 fl oz/A

Foliar fungicide applications were made June 13 (V4), June 26 (V7), July 11 (V11), and July 25

th

(R1).

NIS added to each fungicide treatment at 0.25% v/v

.

No

statistical differences among treatments.

Coefficient of variation is

16.3%.

UTC

V4

V7

V11

R1Slide14

2013 Fungicide Product & Timing Comparison Trial in NE

Stay green % assessed on September 30th, 2013 Kernel dent stage (R6)

Treatment & application rate

Non-treated control

Headline AMP R1, 10 fl oz/A

Aproach

R1, 6 fl oz/A

Stratego YLD V11, 4 fl oz/A

Priaxor

R1, 4 fl oz/A

ab

Stratego YLD V7, 2 fl oz/A

Stratego YLD V4, 4 fl oz/A

Stratego YLD V4, 2 fl oz/A

Stratego YLD V7, 4 fl oz/A

Stratego YLD R1, 4 fl oz/A

ab

a

b

ab

ab

ab

ab

ab

ab

Foliar fungicide applications were made June 13 (V4), June 26 (V7), July 11 (V11), and July 25

th

(R1).

NIS added to each fungicide treatment at 0.25% v/v

. Treatments with different letters are

statistically different. Coefficient of variation is

12.1%.

UTC

V4

V7

V11

R1Slide15

2013 Fungicide Product & Timing Comparison Trial in NE

Push lodging % assessed on October 16th, 2013 Physiological maturity stage (R6)

Treatment & application rate

Non-treated control

Headline AMP R1, 10 fl oz/A

Aproach

R1, 6 fl oz/A

Stratego YLD V11, 4 fl oz/A

Priaxor

R1, 4 fl oz/A

b

Stratego YLD V7, 2 fl oz/A

Stratego YLD V4, 4 fl oz/A

Stratego YLD V4, 2 fl oz/A

Stratego YLD V7, 4 fl oz/A

Stratego YLD R1, 4 fl oz/A

ab

ab

ab

ab

b

b

a

b

b

Foliar fungicide applications were made June 13 (V4), June 26 (V7), July 11 (V11), and July 25

th

(R1).

NIS added to each fungicide treatment at 0.25% v/v

. Treatments with different letters are

statistically different. Coefficient of variation is

119.4%.

UTC

V4

V7

V11

R1Slide16

2013 Fungicide Product & Timing Comparison Trial in NE

500 count kernel weight (g)

Treatment & application rate

Non-treated control

Headline AMP R1, 10 fl oz/A

Aproach

R1, 6 fl oz/A

Stratego YLD V11, 4 fl oz/A

Priaxor

R1, 4 fl oz/A

Stratego YLD V7, 2 fl oz/A

Stratego YLD V4, 4 fl oz/A

Stratego YLD V4, 2 fl oz/A

Stratego YLD V7, 4 fl oz/A

Stratego YLD R1, 4 fl oz/A

Foliar fungicide applications were made June 13 (V4), June 26 (V7), July 11 (V11), and July 25

th

(R1).

NIS added to each fungicide treatment at 0.25% v/v

. No statistical differences among treatments.

Coefficient of variation is

2.2%.

UTC

V4

V7

V11

R1Slide17

2013 Fungicide Product & Timing Comparison Trial in NE

Yield (bu/A) on October 22

nd, 2013

Treatment & application rate

Non-treated control

Headline AMP R1, 10 fl oz/A

Aproach

R1, 6 fl oz/A

Stratego YLD V11, 4 fl oz/A

Priaxor

R1, 4 fl oz/A

b

Stratego YLD V7, 2 fl oz/A

Stratego YLD V4, 4 fl oz/A

Stratego YLD V4, 2 fl oz/A

Stratego YLD V7, 4 fl oz/A

Stratego YLD R1, 4 fl oz/A

ab

ab

ab

ab

ab

ab

a

a

a

Foliar fungicide applications were made June 13 (V4), June 26 (V7), July 11 (V11), and July 25

th

(R1).

NIS added to each fungicide treatment at 0.25% v/v

. Treatments with different letters are

statistically different. Coefficient of variation is

3.7%.

UTC

V4

V7

V11

R1Slide18

2013 Fungicide Product & Timing Comparison Trial in NE

Grain moisture % at harvest on October 22nd

, 2013

Treatment & application rate

Non-treated control

Headline AMP R1, 10 fl oz/A

Aproach

R1, 6 fl oz/A

Stratego YLD V11, 4 fl oz/A

Priaxor

R1, 4 fl oz/A

Stratego YLD V7, 2 fl oz/A

Stratego YLD V4, 4 fl oz/A

Stratego YLD V4, 2 fl oz/A

Stratego YLD V7, 4 fl oz/A

Stratego YLD R1, 4 fl oz/A

Foliar fungicide applications were made June 13 (V4), June 26 (V7), July 11 (V11), and July 25

th

(R1).

NIS added to each fungicide treatment at 0.25% v/v

. No statistical differences among treatments.

Coefficient of variation is

3.3%.

UTC

V4

V7

V11

R1Slide19

Acknowledgments

Casey Schleicher, TechnologistUNL South Central Ag Lab (SCAL) StaffUNL Student WorkersSlide20

Department of Plant Pathology

University of Nebraska-Lincoln

Institute of Agriculture and Natural Resources