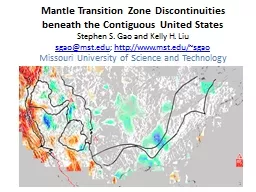
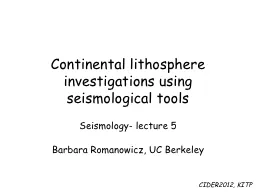
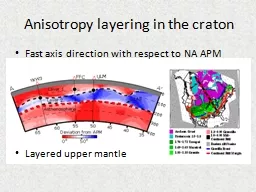
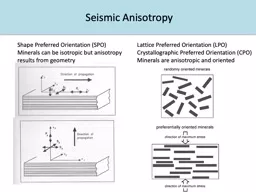
/
Azimuthal anisotropy layering in the Pacific upper mantle Azimuthal anisotropy layering in the Pacific upper mantle

Azimuthal anisotropy layering in the Pacific upper mantle - PowerPoint Presentation

myesha-ticknor
myesha-ticknor . @myesha-ticknor
Follow
393 views
Uploaded On 2017-07-29

Azimuthal anisotropy layering in the Pacific upper mantle - PPT Presentation

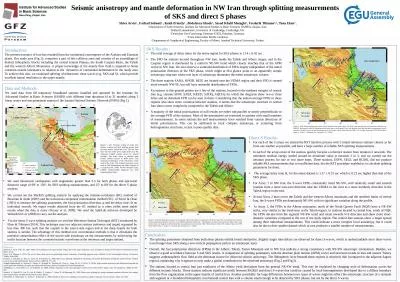
Huaiyu Yuan 123 Scott French 4 and Barbara A Romanowicz 456 1 CCFS EPS Macquarie University Australia 2 CET University of Western Australia Australia ID: 573974

anisotropy lab model azimuthal lab anisotropy azimuthal model layer oceanic pacific apm romanowicz age lithosphere fast inversion depth 2013

Share:

Link:

Embed:

Download Presentation from below link

Download Presentation The PPT/PDF document "Azimuthal anisotropy layering in the Pac..." is the property of its rightful owner. Permission is granted to download and print the materials on this web site for personal, non-commercial use only, and to display it on your personal computer provided you do not modify the materials and that you retain all copyright notices contained in the materials. By downloading content from our website, you accept the terms of this agreement.


Presentation Transcript

Slide1

Azimuthal anisotropy layering in the Pacific upper mantle

Huaiyu

Yuan

1,2,3

, Scott

French

4

and

Barbara A.

Romanowicz

4,5,6

1

CCFS, EPS, Macquarie University, Australia2 CET, University of Western Australia, Australia3 Geological Survey of Western Australia, Australia4 Berkeley Seismological Laboratory, UC Berkeley5 Collège de France, Paris, France6 Institut de Physique du Globe, Paris, France

DI21C-07Slide2

Lithosphere Layering and the LAB Lithosphere-asthenosphere-boundary (LAB): one of “Grand Challenges” of modern seismology (Lay 2009)“Elusive” in continents due to smooth transition in seismic velocity (Eaton 2009; Romanowicz 2009; Fischer et al. 2010)

Most extensively deformed “first-order structural discontinuity” (Eaton 2009) in the global tectonics due to strong plate-asthenosphere couplingDifferential motion accommodated by rock deformation across/at the LAB Slide3

Depth dependent azimuthal anisotropy Craton-wide layering in the upper mantleDomains of anisotropy possessing distinct fast axis directions

Yuan and Romanowicz 2010Layering and the LAB

Fast axis

directions

Fast axis directions

- APM

APM: Absolute Plate Motion directionSlide4

Shallow depleted chemical layer (Layer 1; suture-strike parallel)Sub-thermal layer (Layer 2; high angle to APM)Asthenosphere (current APM parallel)

Yuan and Romanowicz 2010

Lithosphere Layering and the LAB

Cooper and Conrad 2009Slide5

Shallow depleted chemical layer (Layer 1; suture-strike parallel)Sub-thermal layer (Layer 2; high angle to APM)Asthenosphere (current APM parallel)Anisotropic LAB (180-240 km under NA craton)

Yuan and Romanowicz 2010

Lithosphere Layering and the LAB

LAB DepthSlide6

The Oceanic LABOceanic lithosphere covers much larger surface area than continentsShort life span: e.g., Pacific < 200Ma compared with >3Ga of continents

Simple tectonic history; perturbed by input of deep seated thermal upwellings (e.g., French 2013).Slide7

The Oceanic LABSimple tectonic history; perturbed by input of deep seated thermal upwellings (e.g., French 2013).

See French 2013 for details

Poster: DI21A-2267 this afternoon

Talk S21E-07 now Slide8

The Oceanic LABThickness of oceanic lithosphere dictated by thermal history Follows 1 half-space cooling model; 2 plate model;

3 or not (Rychert et al. 2013; Schmerr 2012)Thickness in the range ~ 100 km in the oldest (Schmerr 2012) Paleo-APM at shallow and current APM at depth picked up by azimuthal anisotropy (Montagner 2002; Smith et al. 2004; Debayle et al. 2005; Maggi et al. 2006; Debayle and Ricard 2013)Slide9

The ObjectivesCan we define a Pacific-wide LAB?Oceanic upper mantle layering and its tectonic implications.Slide10

Pacific Inversion

Full waveform inversion using 2D finite-sensitivity kernels (NACT; Li and Romanowicz 1995)Based on an earlier (2007) Berkeley global model that honors true oceanic Moho (Crust2.0);Modified linear crustal correction (Lekic and Romanowicz 2009) applied;5° lateral model spacing; 20-30 km vertical spacing B-splines down to 300 km, then 50-150 down to 1000 km.Isotropic Vs and radial anisotropy ξ; then azimuthal anisotropy strength (G) and fast

axis directionsSlide11

Pacific Inversion60-s global fundamental and overtone waveforms (French et al. 2013); 60- and 40-s Pacific regional network data; OBS waveforms Overall 1.3 million paths; or ~25 million

waveform points handled by NACT for forward and inverse problems Model error handled by bootstrap resampling (Efron and Tibshitani 1986): standard deviation of the 100 “new” modelsNo SKS dataset due to the sparse coverage Slide12

Anisotropy map viewsLayered North America confirmed; although weak but AMP-parallel in the asthenosphere Depth dependent anisotropy domains also found in the PacificModified linear crustal correction (

Lekic and Romanowicz 2009) applied;Full waveform inversion using 2D finite-sensitivity kernels (NACT; Li and Romanowicz 1995)5° lateral model spacing ; 20-30 km vertical spacing B-splines down to 300 km, then 50-150 down to 1000 km.Isotropic Vs and radial anisotropy ξ; then azimuthal anisotropy strength (G) and fast axis

Lithosphere depth

Asthenosphere depth

Below AsthenosphereSlide13

Depth cross-section

Isotropic

Vs

Radial Anisotropy

Azimuthal Anisotropy Strength (%)Fast-axisdirectionSlide14

Resolution Tests

Azimuthal

Anisotropy

Strength (%)Fast-axisdirection

Azimuthal Anisotropy Strength (%)Fast-axisdirection

Input

OutputSlide15

Age Profiles: Vs and LABPlate-model likePunctuated between 70-100 MaRadial Anisotropy

Ritzwoller et al. 2004

Vs Profile

Priestley & McKenzie

2006 Vs Profile

Isotropic Vs Age ProfileSlide16

Age Profiles: Vs and LABDefined by maximum Vs depth gradientSeismic LAB: 30-100 km depth rangeConsistent with S-receiver functions and SS-precursor studies

LAB from

negative Vs gradientSlide17

Age Profiles: Azimuthal AnisotropyCurrent APM direction > 100-140 kmHigh angle to the APM at shallow depthTwo domains of anisotropy

Azimuthal anisotropy

Strength (%)

Fast axis directions

with APM removed

Current Plate Motion

Paleo-plate motionSlide18

Age Profiles:

Azimuthal AnisotropyOceanic lithosphere LAB: 50-140 kmDefined by azimuthal anisotropy

LAB from

Azimuthal

anisotorpySlide19

Two LAB horizonsShallower Vs LABDeeper anisotropy LAB

Velocity LAB

Azimuthal anisotropy LABSlide20

Shallower Vs LAB

Deeper Anisotropy LAB

LAB Age Profiles

LAB from

anisotropy

LAB from VsSlide21

Resembles the continent layer model

Chemical oceanic layer?

Cooper and Conrad 2009

LAB from

anisotropy

LAB from VsSlide22

Depleted

Layer in the oceanic lithosphere (

Hirth

&

Kohlstedt 1996; Lee et al. 2005); thickness

dependent on ambient mantle temperature

Growth of thermal sub-layer when thermal effect out-weights chemical effect

Depleted chemical oceanic layer?

Lee et al. 2005

LAB from Vs

LAB from

anisotropySlide23

Correlation of deep Anisotropic LAB with Large Igneous Provinces?

Role of LIPs

Green area:

Large

Igneous Provinces

(LIPs)

Velocity LAB

Azimuthal anisotropy LABSlide24

ConclusionsLayered oceanic upper mantleUniform fossil lithosphere structureAPM parallel asthenosphereVs LAB shallower than anisotropy LABChemical depleted oceanic layerSlide25
Slide26
Slide27

Age Profiles and Error EstimatesBased on an early Berkeley global model that honors true oceanic Moho (Crust2.0);Modified linear crustal correction (Lekic and Romanowicz 2009) applied;Full waveform inversion using 2D finite-sensitivity kernels (NACT; Li and Romanowicz 1995)

5° lateral model spacing ; 20-30 km vertical spacing B-splines down to 300 km, then 50-150 down to 1000 km.Isotropic Vs and radial anisotropy ξ; then azimuthal anisotropy strength (G) and fast axisSlide28

Pacific Inversion

Model error handled by bootstrap resampling (Efron and Tibshitani 1986): standard deviation of the 100 “new” models60-s global fundamental and overtone waveforms (French et al. 2013) and 60- and 40-s Pacific regional network dataOverall 1.3 million paths (~30 million waveform points) handled by NACT forward and inversion Good azimuthal coverage for Pacific Slide29
Slide30
Slide31
Slide32

Age Profiles: Vs & ζModel points sorted by age and averaged for model parametersIsotropic VsRadial AnisotropySlide33

Age Profiles: Azimuthal AnisotropyModel points sorted by age and averaged for model parametersIsotropic VsRadial AnisotropySlide34

Resolution TestsModel error handled by bootstrap resampling (Efron and Tibshitani 1986): standard deviation of the 100 “new” models60-s global fundamental and overtone waveforms (French et al. 2013) and 60- and 40-s Pacific regional network data

Overall 1.3 million paths (~30 million waveform points) handled by NACT forward and inversion Good azimuthal coverage for Pacific Slide35

Resolution TestsModel error handled by bootstrap resampling (Efron and Tibshitani 1986): standard deviation of the 100 “new” models60-s global fundamental and overtone waveforms (French et al. 2013) and 60- and 40-s Pacific regional network data

Overall 1.3 million paths (~30 million waveform points) handled by NACT forward and inversion Good azimuthal coverage for Pacific