/
Housing units, 2000 Census Housing units, 2000 Census

Housing units, 2000 Census - PDF document

myesha-ticknor
myesha-ticknor . @myesha-ticknor
Follow
419 views
Uploaded On 2015-07-28

Housing units, 2000 Census - PPT Presentation

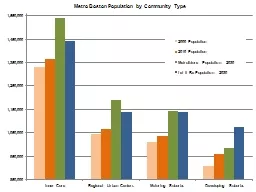
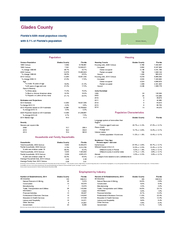
1980 Census 5992 9746961 5790 7302947 1990 Census 7591 12938071 Occupied 3852 6337929 change 198090 267 327 Owneroccupied 3146 4441799 2000 Census 10576 15982824 Renteroc ID: 95796

1980 Census 5 992 9 746 961 5 790 7 302 947 1990 Census 7 591 12 938 071 Occupied 3 852 6 337 929

Share:

Link:

Embed:

Download Presentation from below link

Download Pdf The PPT/PDF document "Housing units, 2000 Census" is the property of its rightful owner. Permission is granted to download and print the materials on this web site for personal, non-commercial use only, and to display it on your personal computer provided you do not modify the materials and that you retain all copyright notices contained in the materials. By downloading content from our website, you accept the terms of this agreement.


Presentation Transcript

1980 Census 5,992 9,746,961 2015 GDP 255,344 839,124,321 1990 Census 7,591 12,938,071 Percent of the State 0.0% % change 1980-90 26.7% 32.7% 2016 GDP 253,267 866,730,997 2000 Census 10,576 15,982,824 Percent of the State 0.0% % change 1990-00 39.3% 23.5% 2017 GDP 266,604 896,117,037 2010 Census 12,884 18,801,332 Percent of the State 0.0% % change 2000-10 21.8% 17.6% 2018 GDP 270,066 924,873,329 Age Percent of the State 0.0% % Under 18 years of age 18.8% 21.3% % 65 years of age and over 21.5% 17.3% Race & Ethnicity % White alone 71.0% 75.0% % Black or African American alone 12.3% 16.0% Housing units, 2000 Census 5,790 7,302,947 % Hispanic or Latino (of any race) 21.1% 22.5% Occupied 3,852 6,337,929 Owner-occupied 3,146 4,441,799 Estimates and Projections Renter-occupied 706 1,896,130 2019 Estimate 13,121 21,208,589 Vacant 1,938 965,018 % change 2010-19 1.8% 12.8% Housing units, 2010 Census 6,979 8,989,580 2020 Estimate 13,609 21,596,068 Occupied 4,533 7,420,802 % change 2019-20 3.7% 1.8% Owner-occupied 3,524 4,998,979 Based on 2019 Estimate Renter-occupied 1,009 2,421,823 2025 13,515 23,130,870 Vacant 2,446 1,568,778 2030 13,749 24,426,178 2035 13,932 25,497,950 Units Permitted 2040 14,086 26,428,726 1990 24 126,384 2045 14,248 27,266,909 2000 25 155,269 2019 Median Age 45.3 41.7 2010 8 38,679 2011 2 42,360 Density 2012 5 64,810 Persons per square mile 2013 8 86,752 2000 13.7 296.4 2014 14 84,075 2010 16.0 350.6 2015 15 109,924 2019 16.3 399.7 2016 58 116,240 2017 13 122,719 2018 36 144,427 Glades County Florida 2019 36 154,302 Persons aged 5 and over 21.6% 29.1% Place of birth Foreign born 9.8% 20.5% Veteran status Civilian population 18 and over 10.7% 8.9% Total households, 2000 Census 3,852 6,338,075 Same house 89.0% 84.3% Family households, 2000 Census 2,764 4,210,760 Different house in the U.S. 10.8% 14.6% % with own children under 18 36.0% 42.3% Same county in Florida 0.8% 8.7% Total households, 2010 Census 4,533 7,420,802 Different county in Florida 7.4% 3.1% Family households, 2010 Census 3,039 4,835,475 Different county in another state 2.7% 2.8% % with own children under 18 32.3% 40.0% Abroad 0.2% 1.1% Average Household Size, 2010 Census 2.52 2.48 Average Family Size, 2010 Census 2.96 3.01 Glades County Florida's 64th most populous county with 0.1% of Florida's population Households Glades County Housing Counts Census Population Florida Population Real Gross Domestic Product Glades County Florida Glades County Residence 1 Year Ago Persons aged 1 and over Florida Households and Family Households According to Census definitions, a household includes all of the people who occupy a housing unit. The occupants may be a single family, one person living alone, two or more families living together, or any other group of related or unrelated people who share living quarters. A family includes a householder and one or more other people living in the same household who are related to the householder by birth, marriage, or adoption. Census counts may be corrected for Census Count Question Resolution (CQR). Real GDP (Thousands of Chained 2012 Dollars) Glades County Florida Population Characteristics Glades County Florida Housing Language spoken at home other than English Glades County Number of Establishments 2019 preliminary Glades County Florida Percent of All Establishments 2019 preliminary Glades County Florida All industries 189 728,687 All industries 189 728,687 Natural Resource & Mining 32 5,301 Natural Resource & Mining 16.9% 0.7% Construction 25 75,725 Construction 13.2% 10.4% Manufacturing 5 20,782 Manufacturing 2.6% 2.9% Trade, Transportation and Utilities 31 140,766 Trade, Transportation and Utilities 16.4% 19.3% Information 1 11,897 Information 0.5% 1.6% Financial Activities 13 77,987 Financial Activities 6.9% 10.7% Professional & Business Services 20 174,242 Professional & Business Services 10.6% 23.9% Education & Health Services 14 77,515 Education & Health Services 7.4% 10.6% Leisure and Hospitality 14 59,068 Leisure and Hospitality 7.4% 8.1% Other Services 13 57,596 Other Services 6.9% 7.9% Government 21 6,044 Government 11.1% 0.8% Industries may not add to the total due to confidentiality and unclassified. All industries 2,007 8,878,680 All industries $43,901 $51,761 Natural Resource & Mining 20.5% 0.8% Natural Resource & Mining $41,378 $35,649 Construction 10.1% 6.3% Construction $52,214 $52,926 Manufacturing 7.2% 4.3% Manufacturing $70,536 $63,883 Trade, Transportation and Utilities 15.7% 20.3% Trade, Transportation and Utilities $43,857 $46,237 Information NA 1.6% Information NA $86,109 Financial Activities 1.7% 6.6% Financial Activities $33,338 $77,030 Professional & Business Services 9.6% 15.7% Professional & Business Services $44,373 $63,747 Education & Health Services 3.9% 14.9% Education & Health Services $32,889 $52,050 Leisure and Hospitality 2.6% 14.2% Leisure and Hospitality $20,468 $26,681 Other Services 1.7% 3.2% Other Services $15,716 $37,972 Government 26.7% 12.1% Government $41,888 $55,897 Industries may not add to the total due to confidentiality and unclassified. 1990 56.6% 64.3% 1990 10.6% 6.1% 2000 49.6% 63.7% 2000 4.7% 3.7% 2010 53.0% 62.2% 2010 9.5% 11.1% 2019 49.8% 61.2% 2019 3.9% 3.1% 1990 $102,153 $257,571,430 1990 $13,373 $19,763 2000 $183,865 $472,238,563 2000 $17,380 $29,428 2010 $255,752 $725,074,023 2010 $19,872 $38,474 2011 $255,671 $764,633,664 2011 $19,918 $40,047 % change 2010-11 0.0% 5.5% % change 2010-11 0.2% 4.1% 2012 $275,507 $793,428,830 2012 $21,745 $41,055 % change 2011-12 7.8% 3.8% % change 2011-12 9.2% 2.5% 2013 $265,879 $795,424,889 2013 $20,982 $40,659 % change 2012-13 -3.5% 0.3% % change 2012-13 -3.5% -1.0% 2014 $283,485 $856,161,682 2014 $21,887 $43,109 % change 2013-14 6.6% 7.6% % change 2013-14 4.3% 6.0% 2015 $314,419 $915,895,494 2015 $23,981 $45,287 % change 2014-15 10.9% 7.0% % change 2014-15 9.6% 5.1% 2016 $297,283 $942,461,242 2016 $22,152 $45,684 % change 2015-16 -5.5% 2.9% % change 2015-16 -7.6% 0.9% 2017 $319,930 $1,004,144,269 2017 $23,510 $47,869 % change 2016-17 7.6% 6.5% % change 2016-17 6.1% 4.8% 2018 $335,785 $1,066,446,916 2018 $24,467 $50,070 % change 2017-18 5.0% 6.2% % change 2017-18 4.1% 4.6% Earnings by Place of Work ($000s) Median Income 1990 $40,750 $161,135,722 Median Household Income $39,879 $53,267 2000 $72,773 $308,751,767 Median Family Income $48,531 $64,312 2010 $112,835 $438,991,235 2011 $107,890 $450,502,115 Percent in Poverty, 2018 % change 2010-11 -4.4% 2.6% All ages in poverty 20.1% 13.7% 2012 $123,451 $468,412,894 Under age 18 in poverty 27.6% 20.0% % change 2011-12 14.4% 4.0% Related children age 5-17 in families in poverty 23.7% 18.8% 2013 $110,250 $482,900,406 % change 2012-13 -10.7% 3.1% Personal Bankruptcy Filing Rate (per 1,000 population) Glades County Florida 2014 $115,098 $512,381,351 12-Month Period Ending Jun. 30, 2019 0.38 2.07 % change 2013-14 4.4% 6.1% 12-Month Period Ending Jun. 30, 2020 0.68 1.89 2015 $130,286 $545,198,370 State Rank 56 NA % change 2014-15 13.2% 6.4% 2016 $126,879 $568,197,880 % change 2015-16 -2.6% 4.2% 2017 $142,924 $601,927,042 % change 2016-17 12.6% 5.9% 2018 $148,649 $634,065,871 Under 65 years 74.1% 83.9% % change 2017-18 4.0% 5.3% Under 19 years 86.2% 92.4% 18 to 64 years 70.3% 80.8% Florida Glades County Florida Health Insurance Status Percent Insured by Age Group NonBusiness Chapter 7 & Chapter 13 Page 2 Glades County Average Annual Wage 2019 preliminary Florida Florida Labor Force as Percent of Population Aged 18 and Older Labor Force Average Annual Employment, % of All Industries, 2019 preliminary Unemployment Rate Florida Florida Glades County Glades County Income and Financial Health Glades County Florida Personal Income ($000s) Per Capita Personal Income Glades County Glades County Employment by Industry Glades County Total - All Revenue Account Codes ($000s) $27,582.3 $44,214,365.8 Total - All Expenditure Account Codes ($000s) $26,499.87 $41,792,449.68 Per Capita $ $2,121.39 $2,223.20 Per Capita $ $2,038.14 $2,101.42 % of Total 100.0% 100.0% % of Total 100.0% 100.0% Taxes ($000s) $8,966.0 $14,725,283.7 General Government Services** ($000s) $4,601.37 $7,105,044.04 Per Capita $ $689.59 $740.42 Per Capita $ $353.90 $357.26 % of Total 32.5% 33.3% % of Total 17.4% 17.0% Permits, Fee, and Special Assessments ($000s) $323.2 $2,064,228.9 Public Safety ($000s) $14,176.16 $10,202,428.55 Per Capita $ $24.86 $103.79 Per Capita $ $1,090.31 $513.00 % of Total 1.2% 4.7% % of Total 53.5% 24.4% Intergovernmental Revenues ($000s) $6,839.7 $4,552,371.7 Physical Environment ($000s) $692.60 $4,910,992.05 Per Capita $ $526.05 $228.90 Per Capita $ $53.27 $246.94 % of Total 24.8% 10.3% % of Total 2.6% 11.8% Charges for Services ($000s) $8,787.6 $13,745,670.4 Transportation ($000s) $4,264.80 $5,056,604.18 Per Capita $ $675.86 $691.16 Per Capita $ $328.01 $254.26 % of Total 31.9% 31.1% % of Total 16.1% 12.1% Judgments, Fines, and Forfeits ($000s) $252.5 $198,680.9 Economic Environment ($000s) $278.53 $1,566,748.75 Per Capita $ $19.42 $9.99 Per Capita $ $21.42 $78.78 % of Total 0.9% 0.4% % of Total 1.1% 3.7% Miscellaneous Revenues ($000s) $728.1 $1,189,350.3 Human Services ($000s) $315.65 $3,545,609.16 Per Capita $ $56.00 $59.80 Per Capita $ $24.28 $178.28 % of Total 2.6% 2.7% % of Total 1.2% 8.5% Other Sources ($000s) $1,685.2 $7,738,780.0 Culture / Recreation ($000s) $320.50 $1,704,980.28 Per Capita $ $129.61 $389.12 Per Capita $ $24.65 $85.73 % of Total 6.1% 17.5% % of Total 1.2% 4.1% Other Uses and Non-Operating ($000s) $1,751.55 $6,807,083.14 Per Capita $ $134.71 $342.28 % of Total 6.6% 16.3% ** (Not Court-Related) Court-Related Expenditures ($000s) $98.72 $892,959.54 Per Capita $ $7.59 $44.90 % of Total 0.4% 2.1% Crime rate, 2019 (index crimes per 100,000 population) 1,135.6 2,551.1 Place of Work in Florida Admissions to prison FY 2018-19 43 28,782 Worked outside county of residence 56.3% 17.7% Travel Time to Work 327.7 135.7 Mean travel time to work (minutes) 33.7 27.4 State Highway County-Wide Not County-Wide* Centerline Miles 85.8 12,128.1 County 9.1367 2.9000 Lane Miles 229.5 45,030.3 School 6.0440 State Bridges Municipal 0.3061 Number 37 7,044 Special Districts 0.2398 0.4484 *MSTU included in Not County-Wide "County" category State Facilities Buildings/Facilities (min. 300 Square Feet) Number 23 9,630 Square Footage 285,834 66,989,245 Total (state total includes special districts) 5 3,721 Conservation Land (land acres only) Elementary 2 1,878 State-Owned (includes partially-owned) 45,570 5,383,024 Middle 0 575 % of Total Conservation Land (CL) 49.4% 51.6% Senior High 0 713 % of Total Area Land 8.9% 15.7% Combination 3 555 % of Florida State-Owned CL 0.8% State-Managed 71,932 5,486,474 % of Total Conservation Land (CL) 78.0% 52.6% % HS graduate or higher 75.6% 88.0% % of Total Area Land 14.0% 16.0% % bachelor's degree or higher 9.9% 29.2% % of Florida State-Managed CL 1.3% Educational attainment Persons aged 25 and older Glades County Florida Education Quality of Life Page 3 Reported County Government Revenues and Expenditures Glades County Florida* Glades County School District Florida 2019 Ad Valorem Millage Rates Glades County * All County Governments Except Duval - The consolidated City of Jacksonville / Duval County figures are included in municipal totals rather than county government totals. Florida* Expenditures 2017-18 Public Education Schools Traditional Setting (2019-20) Revenue 2017-18 State and Local Taxation State Infrastructure Glades County Glades County Florida Workers Aged 16 and Over Florida Crime Glades County Florida Admissions to prison per 100,000 population FY 2018-19 Transportation Prepared by:   Florida Legislature Office of Economic and Demographic Research 111 W. Madison Street, Suite 574 Tallahassee, FL 32399-6588 (850) 487-1402 http://edr.state.fl.us November 2020 Glades County