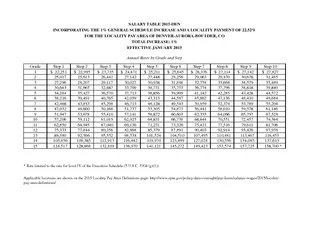
/
SALARY TABLE BOS INCORPORATING THE  GENERAL SCHEDULE INCREASE AND A LOCALITY PAYMENT OF SALARY TABLE BOS INCORPORATING THE  GENERAL SCHEDULE INCREASE AND A LOCALITY PAYMENT OF

SALARY TABLE BOS INCORPORATING THE GENERAL SCHEDULE INCREASE AND A LOCALITY PAYMENT OF - PDF document

myesha-ticknor
myesha-ticknor . @myesha-ticknor
Follow
491 views
Uploaded On 2014-11-27

SALARY TABLE BOS INCORPORATING THE GENERAL SCHEDULE INCREASE AND A LOCALITY PAYMENT OF - PPT Presentation

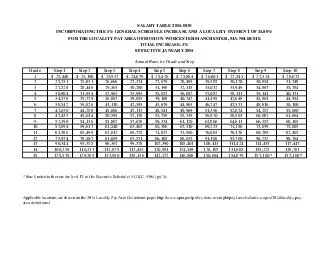
80 FOR THE LOCALITY PAY AREA OF BOSTONWORCESTERMANCHESTER MANHRIME TOTAL INCREASE 1 EFFECTIVE JANUARY 2014 Annual Rates by Grade and Step Grade Step 1 Step 2 Step 3 Step 4 Step 5 Step 6 Step 7 Step 8 Step 9 Step 10 1 22440 23190 23937 24679 2542 ID: 17697

FOR THE LOCALITY PAY

Share:

Link:

Embed:

Download Presentation from below link

Download Pdf The PPT/PDF document "SALARY TABLE BOS INCORPORATING THE GENE..." is the property of its rightful owner. Permission is granted to download and print the materials on this web site for personal, non-commercial use only, and to display it on your personal computer provided you do not modify the materials and that you retain all copyright notices contained in the materials. By downloading content from our website, you accept the terms of this agreement.


Presentation Transcript

SALARY TABLE 2014-BOS INCORPORATING THE 1% GENERAL SCHEDULE INCREASE AND A LOCALITY PAYMENT OF 24.80% FOR THE LOCALITY PAY AREA OF BOSTON-WORCESTER-MANCHESTER, MA-NH-RI-ME TOTAL INCREASE: 1% EFFECTIVE JANUARY 2014 Annual Rates by Grade and Step Grade Step 1 Step 2 Step 3 Step 4 Step 5 Step 6 Step 7 Step 8 Step 9 Step 10 1 $ 22,440 $ 23,190 $ 23,937 $ 24,679 $ 25,426 $ 25,864 $ 26,601 $ 27,345 $ 27,374 $ 28,073 2 25,231 25,831 26,666 27,374 27,679 28,493 29,307 30,120 30,934 31,748 3 27,528 28,446 29,363 30,280 31,198 32,115 33,032 33,949 34,867 35,784 4 30,904 31,934 32,963 33,993 35,023 36,052 37,082 38,111 39,141 40,171 5 34,576 35,729 36,882 38,035 39,188 40,342 41,495 42,648 43,801 44,954 6 38,542 39,826 41,110 42,395 43,679 44,963 46,247 47,531 48,816 50,100 7 42,830 44,258 45,686 47,113 48,541 49,969 51,396 52,824 54,252 55,680 8 47,433 49,014 50,595 52,176 53,758 55,339 56,920 58,501 60,082 61,664 9 52,390 54,136 55,882 57,628 59,374 61,120 62,866 64,611 66,357 68,103 10 57,694 59,617 61,540 63,463 65,386 67,310 69,233 71,156 73,079 75,002 11 63,386 65,499 67,612 69,725 71,837 73,950 76,063 78,176 80,289 82,402 12 75,974 78,507 81,039 83,571 86,103 88,635 91,168 93,700 96,232 98,764 13 90,344 93,355 96,367 99,378 102,390 105,401 108,413 111,424 114,435 117,447 14 106,759 110,317 113,875 117,433 120,991 124,549 128,107 131,665 135,223 138,781 15 125,579 129,765 133,950 138,136 142,322 146,508 150,694 154,879 157,100 * 157,100 * * Rate limited to the rate for level IV of the Executive Schedule (5 U.S.C. 5304 (g)(1)). Applicable locations are shown on the 2014 Locality Pay Area Definitions page: http://www.opm.gov/policy-data-oversight/pay-leave/salaries-wages/2014/locality-pay- area-definitions/