PDF-The Disgust Propensity and Sensitivity Scale
Author : myesha-ticknor | Published Date : 2016-11-23
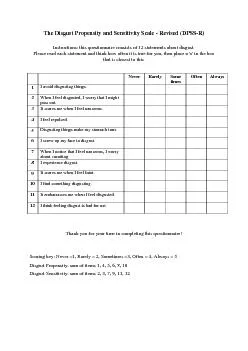
Revised DPSS R Instructions this questionnaire consists of 12 statements about disgust Please read each statement and think how often it is true for you then place
Presentation Embed Code
Download Presentation
Download Presentation The PPT/PDF document "The Disgust Propensity and Sensitivity S..." is the property of its rightful owner. Permission is granted to download and print the materials on this website for personal, non-commercial use only, and to display it on your personal computer provided you do not modify the materials and that you retain all copyright notices contained in the materials. By downloading content from our website, you accept the terms of this agreement.
The Disgust Propensity and Sensitivity Scale: Transcript
Download Rules Of Document
"The Disgust Propensity and Sensitivity Scale"The content belongs to its owner. You may download and print it for personal use, without modification, and keep all copyright notices. By downloading, you agree to these terms.
Related Documents